What is global liquidity?
Global liquidity is how easy it is to borrow and move money across the world's financial system. It comes from central banks and from private lenders such as banks and bond markets. Because so much borrowing is in US dollars, looser liquidity tends to soften the dollar and tighter liquidity tends to lift it.
ខ្លឹមសារនេះមានតែជាភាសាអង់គ្លេសសិន។

When money is cheap to borrow almost everywhere at once, investors tend to take more risk and capital flows toward emerging economies. When money turns scarce, that flow can reverse quickly.
Global liquidity is the name for this worldwide supply of money and credit, and it shapes the background against which every currency trades.
What does global liquidity mean?
Picture a year when banks lend freely and a company in an emerging economy can borrow dollars at a low rate. Then picture a year when lenders demand more security and some borrowers cannot get a new loan to repay the old one.
Global liquidity is the ease of getting money and credit across the world's financial system. It covers the amount available and how willingly lenders move it across borders.
The word has a second meaning. The market size and liquidity lesson uses it for market liquidity: how easily you can trade a pair without moving its price. Global liquidity is about funding, the money behind those trades.
The two are separate ideas, yet they often dry up together in a crisis, when lenders pull back and dealers widen their prices.
Where does global liquidity come from?
It has two sources. The first is official liquidity, the money central banks create.
A central bank sets short-term interest rates. It can also buy assets to put new money into the banking system, a policy called quantitative easing (QE).
Say a central bank buys $100 billion of government bonds from banks. It pays by crediting their reserve accounts, so bank reserves rise by $100 billion. The amount is a round illustrative figure.
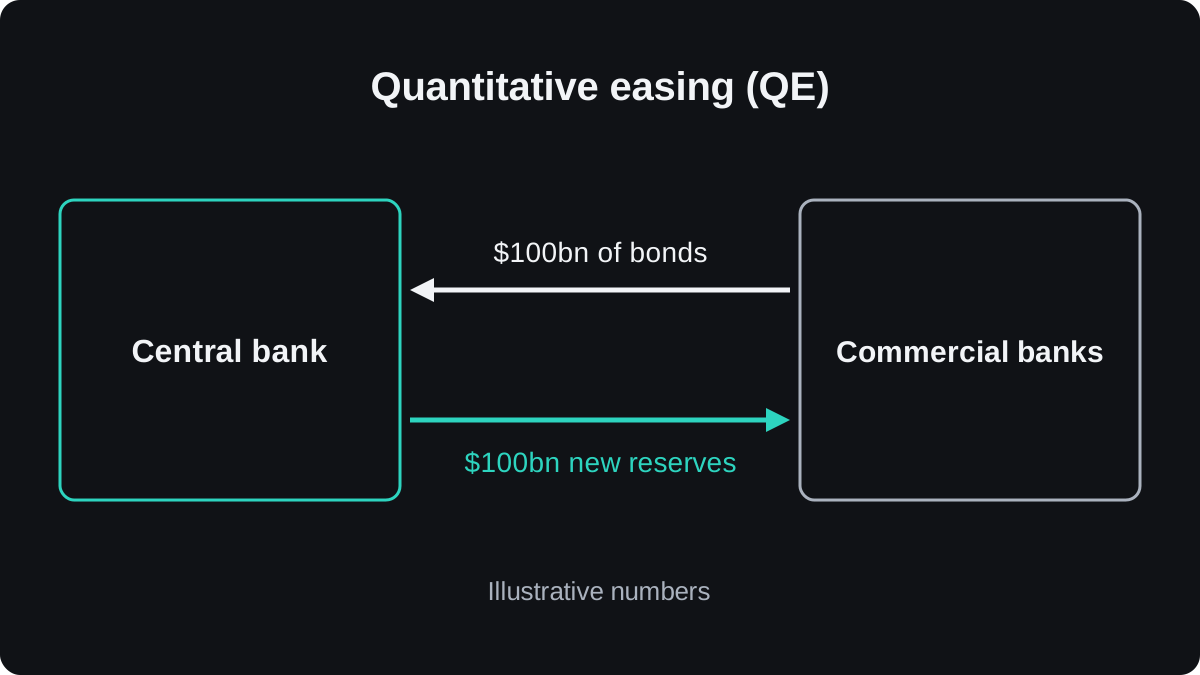
The reverse is quantitative tightening (QT). The central bank lets bonds mature without replacing them, or sells them, and reserves shrink.
Several large central banks used QE after the 2008 financial crisis and again in 2020. The central banks lesson covers their tools in more detail.
The second source is private liquidity: bank loans, bond issuance and short-term lending between banks and funds. In normal times most credit comes from private lenders, and their willingness to lend rises and falls with confidence.
Lenders give more when prices are rising and pull back when losses appear. Private liquidity can therefore shrink just when borrowers need it most, and a central bank can make money cheap without being able to make anyone lend it.
Why does the US dollar sit at the centre?
A large share of cross-border loans, bonds and trade invoices is written in US dollars, and the dollar is on one side of most forex deals.
That is why the Federal Reserve's decisions change the cost of money for borrowers far outside the United States. The US dollar profile explains how the currency came to hold this role.
This creates a loop. When the dollar falls, foreign dollar debts get lighter in local terms and borrowing grows.
When the dollar rises, those debts get heavier. Borrowers rush to buy dollars to repay, and that demand can push the dollar higher still.
Worked example: a dollar loan in a weaker currency
A company earns its revenue in its local currency, written LC here. All numbers are illustrative.
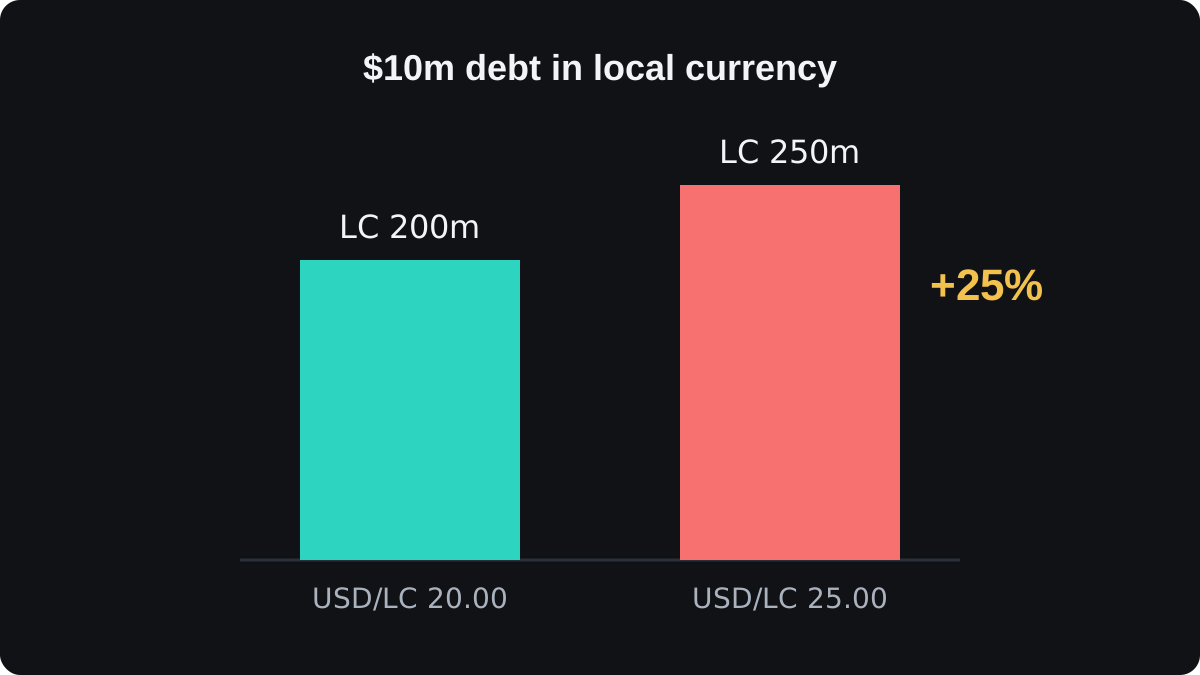
- It borrows $10,000,000 when USD/LC is 20.00. In local terms the debt is 10,000,000 × 20.00 = LC 200,000,000.
- The loan charges 5% a year, so interest is $500,000. At 20.00 that costs 500,000 × 20.00 = LC 10,000,000.
- Dollar funding tightens and USD/LC rises to 25.00. The debt is now 10,000,000 × 25.00 = LC 250,000,000.
- The rise is 50,000,000 ÷ 200,000,000 = 25%.
- The yearly interest becomes 500,000 × 25.00 = LC 12,500,000, also 25% more than before.
The company's sales have not changed, yet its debt grew by LC 50,000,000.
Seen from the other side, one unit of local currency fell from 0.050 to 0.040 dollars, a loss of 20% of its dollar value, and that was enough to lift the debt by 25%.
Multiply this across many borrowers and countries, and a tighter dollar can put heavy pressure on emerging market currencies. The lesson on dollar funding follows what happens under real stress.
How does liquidity show up in currency prices?
Loose liquidity tends to come with risk-on behaviour. Investors borrow in low-rate currencies and buy higher-yielding assets, which is the carry trade.
In those phases emerging market currencies often gain, and the dollar often softens.
Tight liquidity tends to bring the reverse. Carry trades unwind, so traders buy back the low-rate currency they borrowed.
When the yen or the Swiss franc has had low interest rates, both have often strengthened in these phases. The dollar often firms too, as borrowers chase it to repay debts.
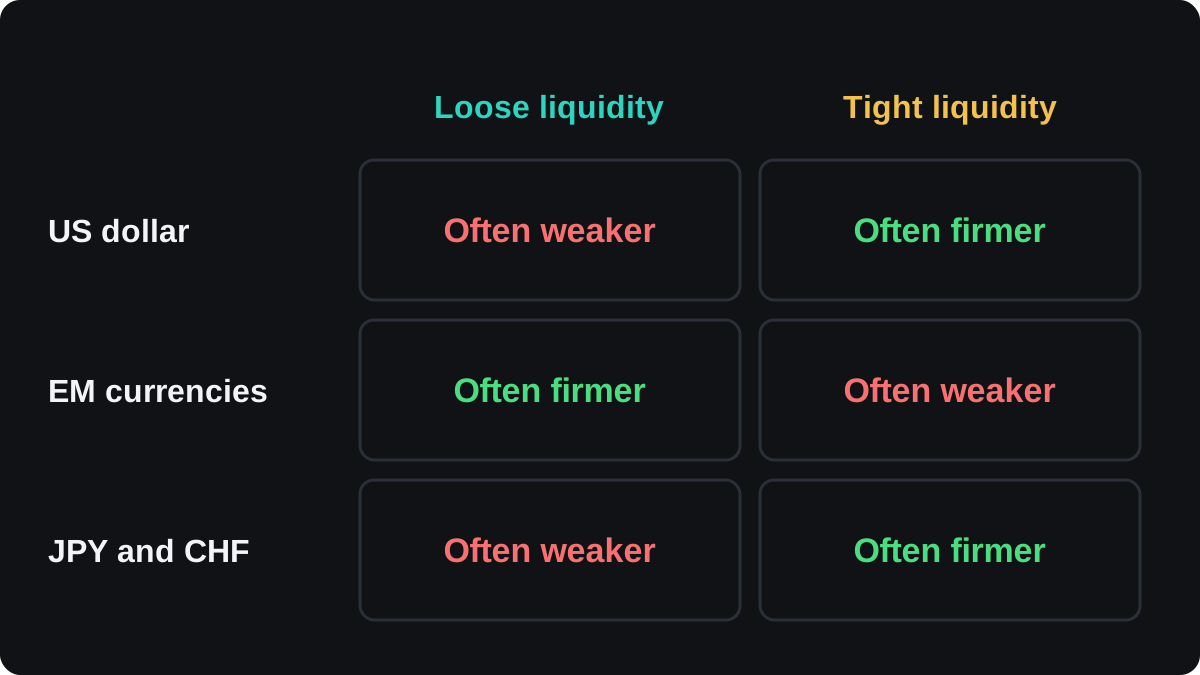
Treat these as tendencies. Interest rate gaps between countries still drive a great deal, as the interest rates lesson shows, and the same liquidity change can hit two currencies very differently.
The risk-on and risk-off lesson covers how these mood shifts spread across stocks, bonds and currencies.
How can you watch global liquidity, and where does it fail?
No single official number exists. Analysts piece it together from several sources:
- Central bank balance sheets. The Federal Reserve publishes its balance sheet every week, and other central banks publish theirs on their own schedules.
- Broad money supply, such as M2 in the United States, in large economies.
- The global liquidity indicators of the Bank for International Settlements, which track cross-border bank credit and dollar credit to borrowers outside the United States.
- Credit spreads, the extra yield companies pay over government bonds. Wider spreads usually mean tighter conditions, and the bond yields lesson explains how yields work.
These measures often disagree, and they arrive late. Monthly or quarterly data can describe conditions that have already changed, while a crisis can drain funding in days.
Some widely shared charts lay a global money supply line over a currency or an asset price. Both lines often rise over time, so they can look matched without one driving the other. Evidence for timing trades with them is weak.
Local events can also swamp the global picture. An election, a surprise rate decision or a currency intervention can move one currency against the tide.
Global liquidity describes background conditions, and it gives no signal for when to buy or sell a particular pair.
សំណួរ
Is global liquidity the same as money supply?
Money supply is one part of it. Global liquidity also includes credit from banks and bond markets, and how freely that credit crosses borders.
Does more global liquidity make the US dollar weaker?
It often has, because cheap dollar funding encourages borrowing and flows into other currencies. The link is loose, and rate differences or a crisis can push the dollar the other way.
Why does US monetary policy affect other currencies?
So much of the world borrows and trades in dollars that Federal Reserve decisions change funding costs far beyond the United States. A tighter Fed can raise the local cost of dollar debt in many countries at once.
Can you trade using global liquidity data?
It can help you understand the background, such as why emerging market currencies are under pressure. The data is slow and the links are loose, so the evidence for using it to time entries is weak.
What is quantitative tightening?
It is the reverse of quantitative easing. A central bank shrinks its balance sheet by letting bonds mature without replacing them, or by selling them, which removes reserves from the banking system.