Bond yields and currencies.
A bond yield is the return a government bond pays at its current price. The yield spread is one country's yield minus another's. When the spread moves in a currency's favour, that currency often strengthens, sometimes after a delay. The link is common but unreliable, and it can break in panics and debt scares.

Suppose two-year government bonds in the US pay 4.00% a year and similar German bonds pay 2.50%. An investor holding euros now has a reason to think about holding dollars instead.
The gap between those two yields often moves in step with EUR/USD, and it sometimes turns before the exchange rate does. Every yield in this lesson is a round illustrative number, not a current reading.
What is a bond yield?
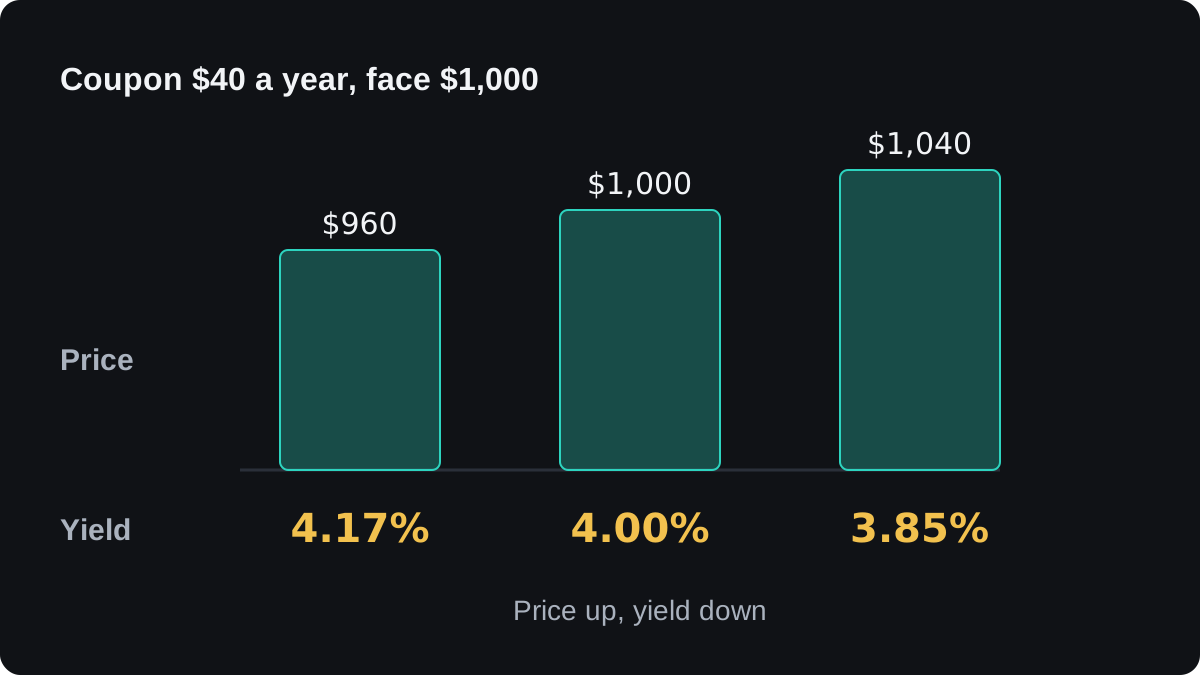
A government bond is a loan to a government. Say a bond has a face value of $1,000, repays that $1,000 when it matures, and pays a fixed $40 of interest each year, called the coupon.
If you buy it for exactly $1,000, you earn 40 ÷ 1,000 = 4.00% a year. That return, measured against the price you pay, is the bond's yield.
Bonds trade every day, so the price moves. At $960 the same $40 coupon is 40 ÷ 960 = 4.17%. At $1,040 it is 40 ÷ 1,040 = 3.85%.
Price and yield therefore move in opposite directions. When investors sell a country's bonds, prices fall and yields rise.
This simple ratio is called the current yield. Quoted yields are usually yield to maturity, which also counts the gain or loss between the price paid and the face value, but the direction works the same way.
Why the two-year yield follows the central bank
Short-term bond yields track the policy rate investors expect over the life of the bond. If the market expects rate hikes over the next two years, the two-year yield usually rises before they happen.
That makes the two-year yield a live reading of interest rate expectations. It reacts to inflation and jobs data, and to speeches by central bank officials.
Ten-year yields carry more than policy. They also reflect long-run growth, long-run inflation and the extra return lenders want for tying money up longer, so they are a looser guide to the next few rate decisions.
The central banks lesson explains how policy rates are set and announced.
How do you calculate a yield spread?
A yield spread is one country's bond yield minus another country's yield, for bonds of the same maturity. For a currency pair, take the base currency's yield minus the quote currency's yield.
Spreads are usually quoted in basis points (bp). One basis point is 0.01 percentage point, so a gap of 1.50 percentage points is 150 bp.
Here is a worked example for EUR/USD, with illustrative yields. German bonds are a common stand-in for the euro, since the euro area has no single national government.
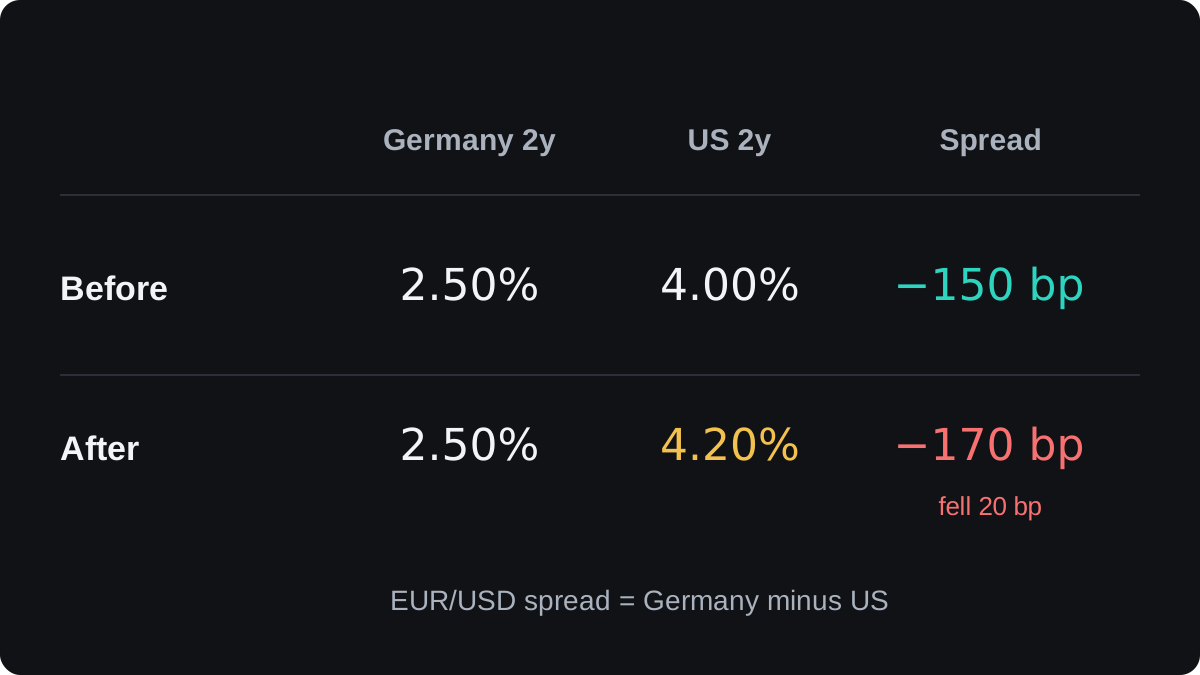
- The German two-year yield is 2.50% and the US two-year yield is 4.00%.
- The EUR/USD spread is 2.50 − 4.00 = −1.50 points, or −150 bp.
- Strong US jobs data lift the US two-year yield to 4.20%. The German yield stays at 2.50%.
- The new spread is 2.50 − 4.20 = −1.70 points, or −170 bp.
- The spread fell by 20 bp. Dollar bonds now pay relatively more, which points toward a lower EUR/USD.
The same rule works for any pair. With an illustrative US two-year yield of 4.00% and a Japanese one of 0.50%, the USD/JPY spread is 4.00 − 0.50 = +3.50 points, or +350 bp.
A rising spread tends to go with a rising pair, and a falling spread with a falling pair. The size of the spread matters less than which way it is moving.
Why does the spread sometimes move first?
The idea has some logic behind it. Rate expectations change first, and they show up most cleanly in short-term bonds, because those bonds are priced almost entirely on the expected path of policy rates.
Currency flows can follow over a longer period. Investors moving savings into higher-paying bonds, or companies changing how they hedge, may adjust over weeks.
The chart below is drawn for teaching. The spread falls first, from −150 bp to −190 bp, and EUR/USD follows later, sliding from about 1.1000 to about 1.0900.
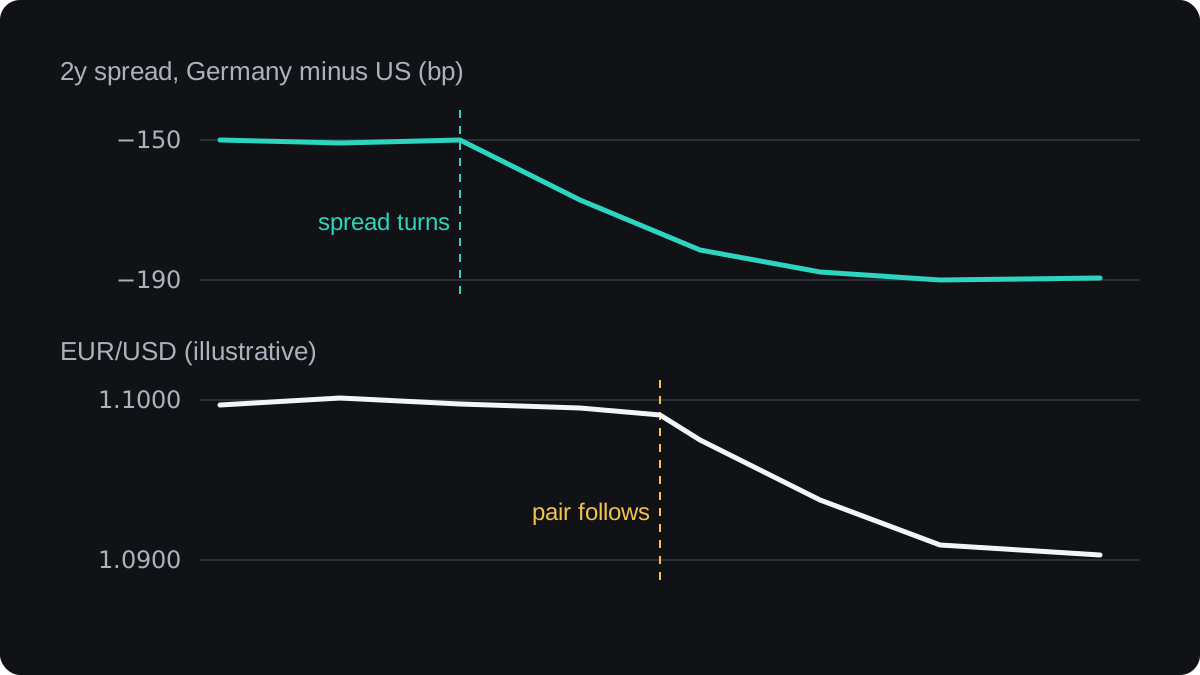
That slide is 0.0100, or 100 pips. On 0.10 lot of EUR/USD a pip is worth 10,000 × 0.0001 = $1, so the move is worth 100 × $1 = $100, a loss on a long trade and a gain on a short one.
Real charts are messier than this sketch. Often both markets jump within the same minute of a data release, sometimes the currency moves before the bonds, and there is no fixed lag you can count on.
When the link between yields and currencies breaks
A spread that widened months ago may already be priced into the exchange rate. What tends to move a currency is a fresh change in the spread, especially an unexpected one, the theme of the expectations versus actual lesson.
Fear can flip the relationship. In a panic, investors buy safe government bonds, pushing yields down, while currencies seen as safe, such as the yen and the Swiss franc, can rise. The risk-on and risk-off lesson covers this.
Yields can also rise for a bad reason. If investors worry about a government's debt or about runaway inflation, they demand more to hold its bonds, and the currency can fall while yields climb.
Inflation matters in a quieter way too. A yield rise that only matches higher expected inflation leaves the real yield, the return after inflation, unchanged. Inflation-linked government bonds, in countries that issue them, show real yields directly.
A central bank can also buy or sell its own currency in the market, which can overpower what the spread suggests for a while.
How to use yield spreads without over-trusting them
Many charting platforms and financial news sites show government bond yields by country and maturity. Symbols differ between providers, so confirm you are reading the two-year bond of the right country before you subtract.
Compare the direction of the spread with the direction of the pair over the same few weeks. When they disagree, check the reasons in the section above before deciding which one to believe.
A spread is background information with no entry price and no stop. Timing still comes from your own rules, and the fundamentals and technicals lesson shows one way to join the two.
The economic calendar lists the inflation and jobs releases that often move two-year yields. A related gap, between short-term interest rates, is the basis of the carry trade, where you earn or pay the difference through swap.
Questions
Do higher bond yields always make a currency stronger?
No. Higher yields from expected rate hikes often support a currency, but yields that rise because investors fear debt problems or inflation can come with a weaker currency.
Which bond yield matters most for forex?
The two-year yield is the closest guide to expected central bank policy, so it is the usual choice for short-term currency moves. Ten-year yields matter for longer views but mix in more factors.
What is a basis point?
A basis point is 0.01 percentage point. A yield moving from 4.00% to 4.20% has risen 20 basis points.
Can a yield spread tell me when to enter a trade?
Not on its own. It describes the background pull on a pair, and the lag between the spread and the price changes from one period to the next.
Where can I see government bond yields?
Many charting platforms, financial news sites and national debt offices publish them. Check the country and the maturity of each symbol before comparing two of them.
Keep learning
 Chapter 2Commodity currencies.Commodity currencies belong to countries whose exports lean on raw materials: the Australian dollar with iron ore and coal, the Canadian dollar and Norwegian krone with oil, and the New Zealand dollar with dairy. Higher export prices tend to lift these currencies, but the link is loose and changes strength over time.
 Chapter 2Gold and the US dollar.Gold is priced in US dollars, so a weaker dollar tends to raise the gold price and a stronger dollar tends to lower it. US real interest rates often push gold and the dollar in opposite directions too. The link often breaks: in a crisis both can rise together, and heavy gold buying can lift gold in every currency.

