Why use more than one timeframe?
A timeframe is the period each candle on a chart covers, from one minute to one month. One chart shows only one scale, so a rise on the 15-minute chart can be a small bounce inside a daily downtrend. A higher timeframe gives direction and major levels; a lower one gives detail for timing and stops.
이 내용은 현재 영어로만 제공됩니다.

Open GBP/USD on a 15-minute chart and you might see a steady climb all morning. Switch to the daily chart and the same pair could be in the middle of a fall that has lasted for weeks.
Both pictures are accurate, because each chart describes the market at a different scale. Reading more than one timeframe helps you avoid mistaking a small move for a large one.
What is a timeframe on a chart?
On a 1-hour chart, every candle shows one hour of trading: the opening price, the highest and lowest prices, and the closing price. That hour is the chart's timeframe, the stretch of time each candle or bar covers.
MetaTrader labels the standard choices M1, M5, M15 and M30 for minutes, H1 and H4 for hours, then D1, W1 and MN for a day, a week and a month.
A higher timeframe is built from the lower ones. Four 1-hour candles make one 4-hour candle, using the first open, the highest high, the lowest low and the last close.
If you need a refresher on those four prices, see how to read a candlestick. Here are four hourly EUR/USD candles with round illustrative prices:
| Hour | Open | High | Low | Close |
|---|---|---|---|---|
| 1 | 1.1000 | 1.1015 | 1.0995 | 1.1010 |
| 2 | 1.1010 | 1.1030 | 1.1005 | 1.1025 |
| 3 | 1.1025 | 1.1028 | 1.0990 | 1.0995 |
| 4 | 1.0995 | 1.1005 | 1.0980 | 1.0985 |
Combine them step by step:
- Open: the first hour opened at 1.1000.
- High: the highest of the four highs is 1.1030, in hour 2.
- Low: the lowest of the four lows is 1.0980, in hour 4.
- Close: the last hour closed at 1.0985.
The 4-hour candle closed 15 pips below its open, so it is bearish. Its upper wick runs from 1.1000 up to 1.1030, which is 30 pips, and its lower wick is only 5 pips.
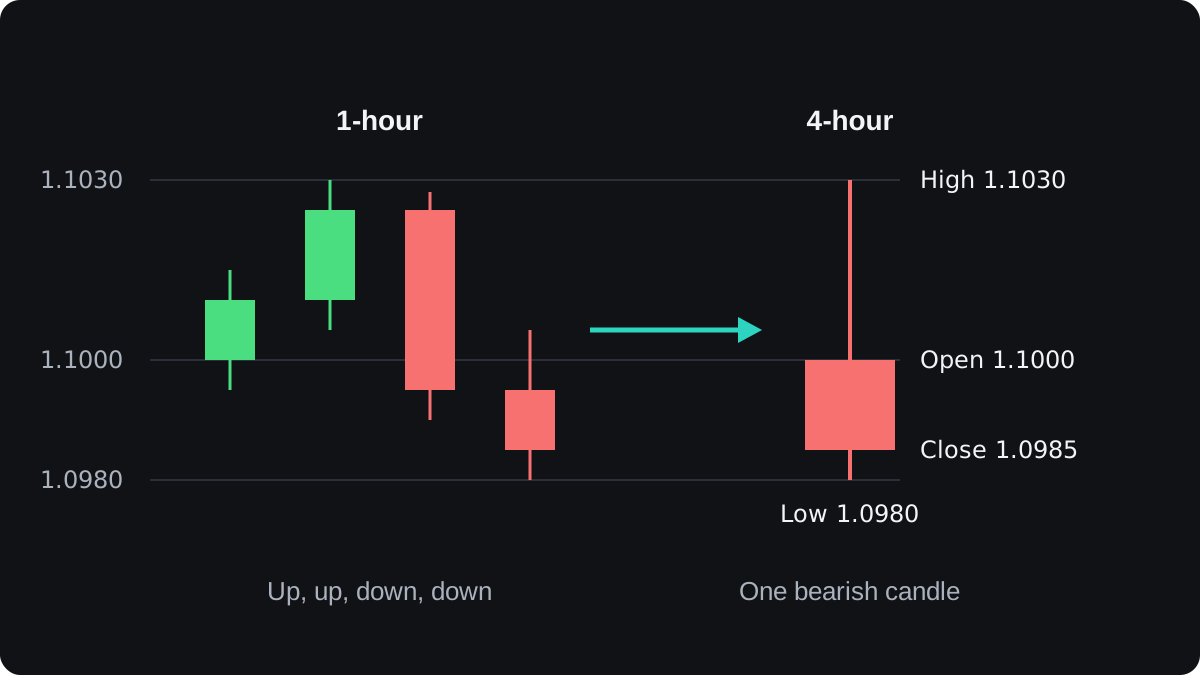
The hourly chart shows a rally of 30 pips to 1.1030, then a fall of 45 pips to close at 1.0985. The 4-hour chart shows the same hours as one red candle with a long upper wick, and the turn inside it disappears.
How can one chart mislead you?
Take the GBP/USD case from the start, with illustrative prices. Over several weeks the daily chart falls from 1.3000 to 1.2500, a drop of 500 pips. One morning the 15-minute chart climbs from 1.2500 to 1.2560.
On the 15-minute chart those 60 pips look like a fresh uptrend, with higher highs and higher lows. On the daily chart they win back 60 ÷ 500 = 12% of the fall, a small bounce near the bottom.
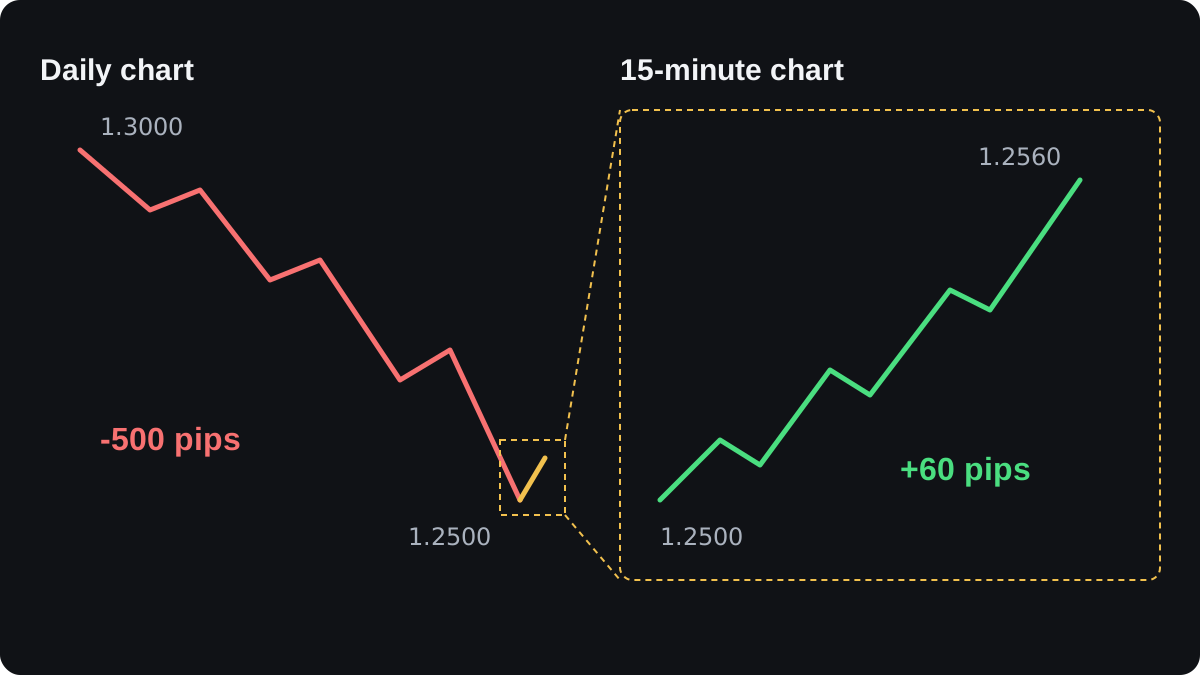
A trader who watches only the short chart might buy and call it following the trend. Seen from the daily chart, that same buy is a bet against the larger move, and the trader never saw it.
The opposite mistake happens too. Someone who reads only the daily chart may pick the right direction but enter at a poor moment, with a stop so far away that the position has to be tiny.
Short timeframes also carry more noise, meaning small swings that look like signals and fade within the hour. A 5-minute chart can print several of them in a morning that leave no mark on the daily chart.
What does the higher timeframe tell you?
The higher chart is where you read the setting. It shows whether the pair is trending or moving sideways, as the lesson on trending and ranging markets explains, and which way a trend points.
It also shows the larger price levels, the places where price turned before. Lines of support and resistance drawn on a daily chart reflect weeks of trading, while a level on a 5-minute chart may reflect an hour.
That longer history is the usual reason larger levels get more weight. Daily levels still break, so treat each one as an area to watch.
What does the lower timeframe add?
Once the higher chart has given you a direction, the lower chart helps with timing. It shows smaller swings, so you can see where a pullback may have ended and where a stop could sit.
That changes your stop distance, and with it your lot size. Take EUR/USD in a USD account, where each 0.01 lot is worth $0.10 per pip, and an illustrative risk budget of $50.
- A stop beyond the last daily swing sits 120 pips away. $50 ÷ 120 = $0.417 per pip.
- $0.417 ÷ $0.10 = 4.17 steps of 0.01 lot, so round down to 0.04 lot. The real risk is 120 × $0.40 = $48.
- A stop beyond the last 1-hour swing sits 30 pips away. $50 ÷ 30 = $1.667 per pip.
- $1.667 ÷ $0.10 = 16.67 steps of 0.01 lot, so round down to 0.16 lot. The real risk is 30 × $1.60 = $48.
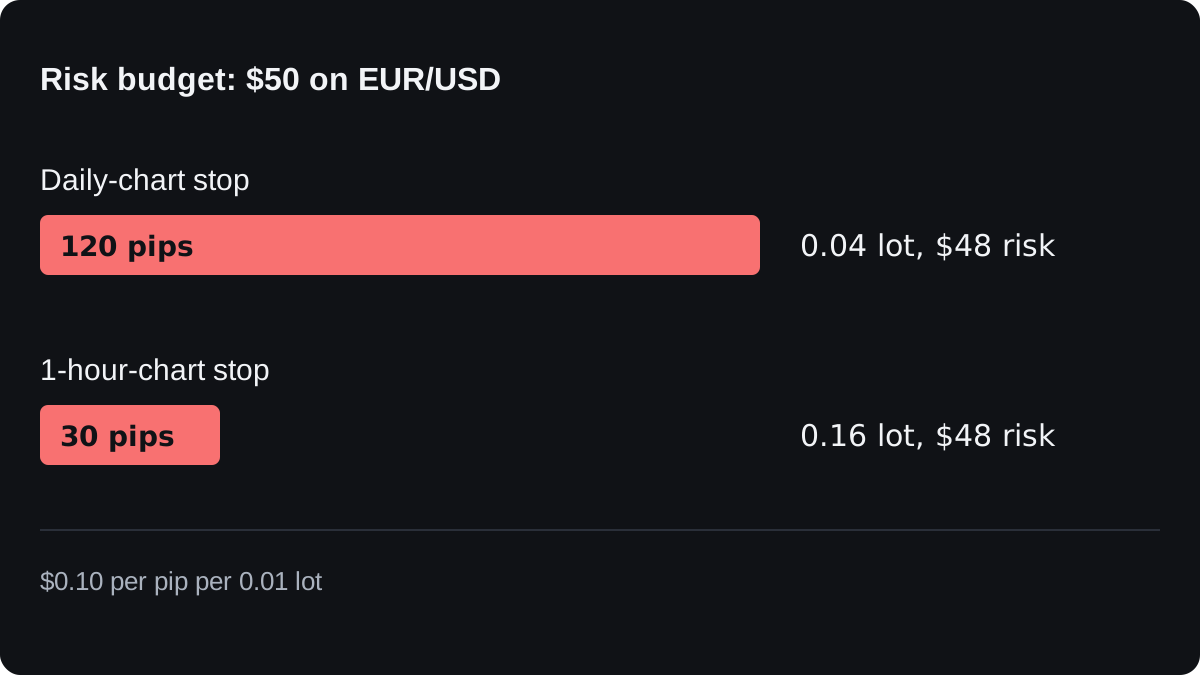
The cash at risk is the same, and the position is four times larger with the tighter stop.
The cost is that a stop 30 pips away sits inside ordinary price swings. It is likely to be hit more often than one 120 pips away.
The full method is in how to calculate position size, and the lot size calculator does the arithmetic for other pairs.
How far apart should the two charts be?
If the two timeframes are too close, such as M15 and M30, they show nearly the same picture.
If they are too far apart, the higher chart says little about the lower. A full 24-hour day holds 1,440 minutes, so one daily candle can contain over a thousand 1-minute candles.
A common rule of thumb is a gap of about four to six times. D1 with H4 is a factor of 6, H4 with H1 is 4, and H1 with M15 is 4.
This convention keeps the two views related, and no single ratio has been shown to be best. Choosing your timeframes covers how to pick a pair of charts that fits your trading hours.
Where does looking at several timeframes fall short?
Timeframes often disagree, sometimes for weeks. No rule says which chart wins, so you still need a plan for what to do when they conflict, even if that plan is to stay out.
More charts also give you more chances to fool yourself. If you flip between timeframes until one agrees with the trade you already wanted, the extra charts have only given you permission.
The larger trend can end at any time. In the GBP/USD example, the fall might have finished at 1.2500, and that 60-pip morning could have been the first leg of a new rise.
Reading two timeframes organises what you look at, and that alone promises nothing about results. Test any rule first, as forward testing on a demo explains, and the top-down analysis lesson turns the idea into a routine.
자주 묻는 질문
What is the best timeframe for forex trading?
There is no single best one. The right chart depends on how long you plan to hold trades and how often you can check them.
How many timeframes should I use?
Two is a manageable start: a higher one for direction and a lower one for timing. Some traders add a third, but every extra chart is another chance for the signals to conflict.
What should I do when the timeframes disagree?
Common choices are to wait until they line up, to trade a smaller size, or to skip the trade. None of these guarantees a better result, so write your choice into your plan and apply it the same way each time.
Are signals on higher timeframes more reliable?
They contain less noise and appear less often, but they still fail. They also tend to need wider stops, which means a smaller position for the same cash risk.
이어서 배우기
 챕터 4Choosing your timeframes.Choose three charts spaced about four to six times apart: a higher trend chart for direction, a middle setup chart where you plan the trade, and a lower entry chart to time the order. Start from the setup chart that fits your holding time. A swing trader might use daily, 4-hour and 1-hour charts.
 챕터 4Top-down analysis step by step.Top-down analysis means reading the same pair from the largest chart to the smallest before you trade. The weekly chart sets the direction, the daily chart finds the price zone, and the 4-hour chart times the entry, stop and size. If the charts disagree, you wait.

