Choosing your timeframes.
Choose three charts spaced about four to six times apart: a higher trend chart for direction, a middle setup chart where you plan the trade, and a lower entry chart to time the order. Start from the setup chart that fits your holding time. A swing trader might use daily, 4-hour and 1-hour charts.
이 내용은 현재 영어로만 제공됩니다.

A swing trader might open the daily chart to judge the trend, the 4-hour chart to find a trade and the 1-hour chart to time the entry.
Each chart's candles cover four to six times as much time as the chart below. If you are unsure why traders use more than one chart at all, start with why use more than one timeframe.
Which chart should you choose first?
Start with the middle chart, the setup chart. This is where you spot a trade and plan it, so it should match how long you hold trades and how often you can watch a screen.
Count candles to test the fit. Say your trades usually last 2 to 5 days. A 4-hour chart prints 6 candles a day, so each trade spans 12 to 30 candles on it.
That is enough candles to watch the trade develop. On a daily chart the same trade lasts only 2 to 5 candles. On a 5-minute chart it lasts 576 to 1,440 candles, far more than one screen shows.
Screen time is the other limit. A 4-hour setup chart needs a look a few times a day, while a 5-minute one needs you at the desk while a trade is open. The trading styles lesson compares holding times.
How far apart should the three charts be?
With the setup chart chosen, the trend chart sits one step above it and the entry chart one step below. A common rule of thumb puts each step at about four to six times the chart beside it.
For a 4-hour setup chart, that points to a daily trend chart and a 1-hour entry chart. A day holds 6 four-hour candles, and each 4-hour candle holds 4 one-hour candles, so one daily candle holds 24.
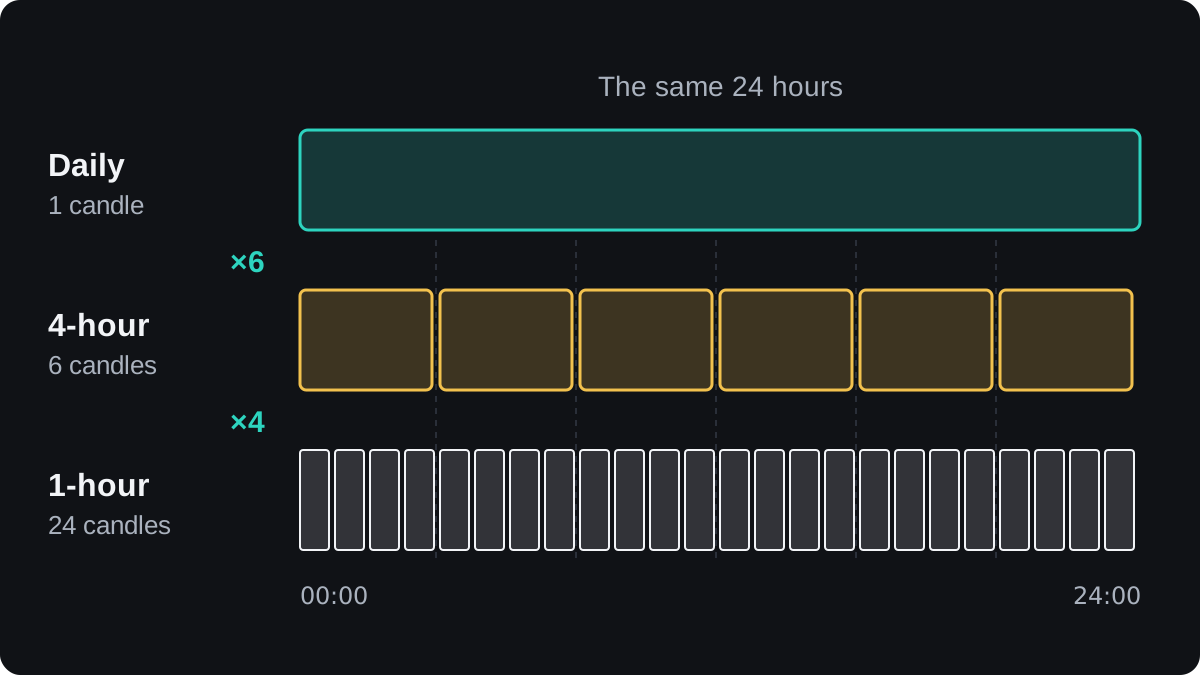
The spacing gives each chart a separate job. The trend chart shows which way the larger move is going, and the setup chart shows the level or pattern you plan to trade.
The entry chart shows what price does inside a single setup candle. That detail is where you choose the exact order price and stop.
Four to six is a convention, and there is no strong evidence that one ratio beats another. Treat it as a starting point you can adjust.
Platforms offer fixed steps. MetaTrader 4 has 1, 5, 15 and 30 minutes, 1 and 4 hours, daily, weekly and monthly, and MetaTrader 5 adds steps in between. Pick the nearest chart your platform offers.
Common timeframe sets by trading style
The table gives one starting set per style. The ratios show how many candles of the lower chart fit inside one candle of the chart above.
| Style | Usual holding time | Trend chart | Setup chart | Entry chart | Ratios |
|---|---|---|---|---|---|
| Scalping | Minutes | 30-minute | 5-minute | 1-minute | 6 and 5 |
| Day trading | Hours, closed the same day | 1-hour | 15-minute | 5-minute | 4 and 3 |
| Swing trading | Days to a few weeks | Daily | 4-hour | 1-hour | 6 and 4 |
| Position trading | Weeks to months | Weekly | Daily | 4-hour | about 5 and 6 |
The day trading set has one step of 3, because MetaTrader 4 has no chart between 5 and 15 minutes. The rule of thumb bends to the steps your platform offers.
A weekly candle in forex holds about five daily candles, one for each trading day. Some brokers also show a short Sunday candle, depending on their server clock.
What goes wrong when the charts are too close or too far apart?
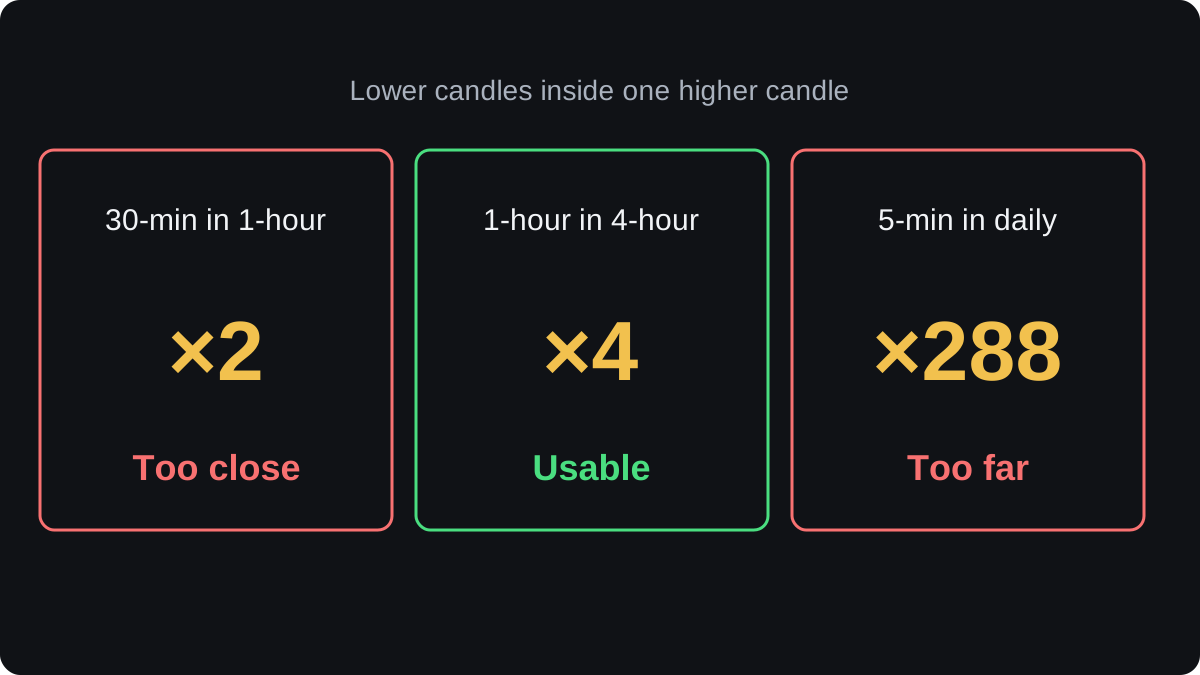
Put a 30-minute chart under a 1-hour chart and the ratio is only 2. Both charts show nearly the same swings, so the second adds little. It can also feel like two confirmations when you have really looked at one.
The opposite mistake is a large gap. A daily candle holds 24 × 12 = 288 five-minute candles. A dip that looks small on the daily chart can look like a full downtrend on the 5-minute chart for days.
With a gap that wide, your trend view and your entry signals describe moves of very different sizes. You may wait days for the entry chart to agree, or enter against a move the trend chart barely shows.
How does the entry chart change your stop and size?
The entry chart often lets you set a closer stop loss, which changes your position size for the same risk. The prices below are illustrative.
Say EUR/USD is rising on the daily chart and the 4-hour chart shows a pullback to support. You plan to buy at 1.10600 and risk $50, which is 1% of a $5,000 account in US dollars.
- On the 4-hour chart, the last swing low is at 1.10000. A stop there is 1.10600 minus 1.10000 = 0.00600, or 60 pips.
- In a USD account, one standard lot of EUR/USD is worth $10 a pip. $50 ÷ (60 × $10) = 0.083 lot, which you round down to 0.08 lot. At $0.80 a pip, 60 pips risk $48.
- On the 1-hour chart, a smaller swing low has formed at 1.10350. A stop there is 1.10600 minus 1.10350 = 0.00250, or 25 pips.
- $50 ÷ (25 × $10) = 0.20 lot. At $2.00 a pip, 25 pips risk $50.
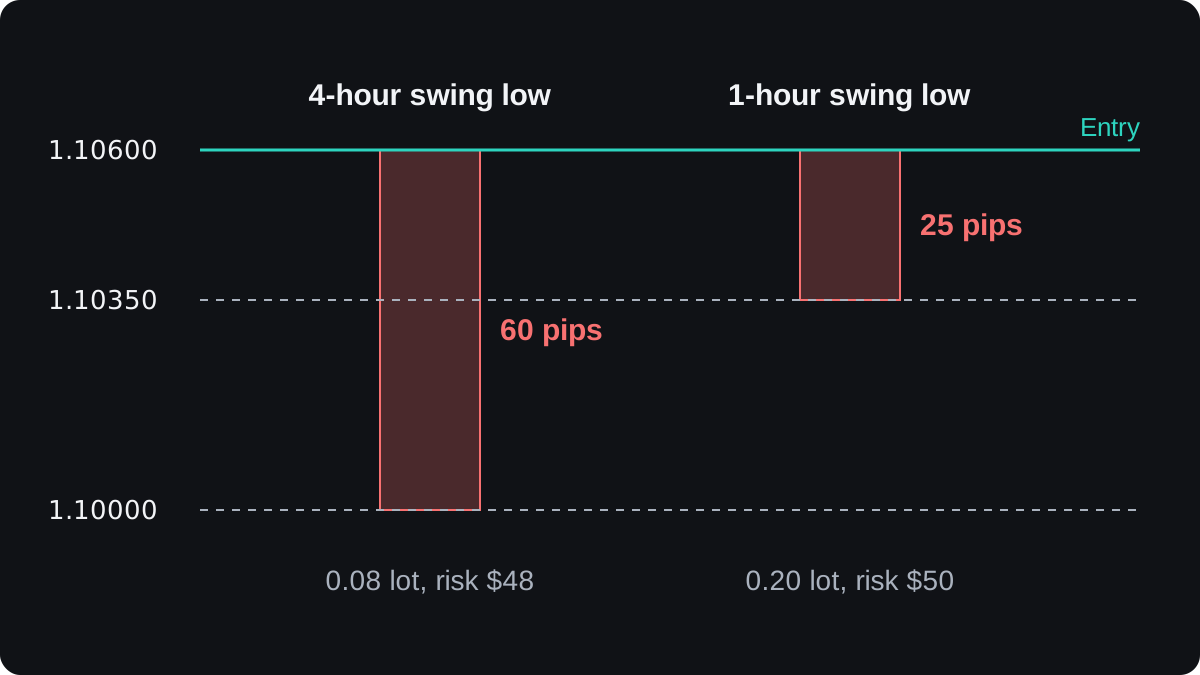
The money at risk is almost the same, yet the second position is two and a half times larger, because 0.20 ÷ 0.08 = 2.5.
In practice you would place each stop a few pips below the low to allow for the spread. The example leaves that out to keep the sums clean.
The closer stop has a cost. It sits inside the normal swings of the 4-hour chart, so ordinary noise is more likely to reach it before the trade has a chance to work.
You can repeat this arithmetic with the lot size calculator, and the full method is in how to calculate position size.
Why keep the same set from trade to trade?
Pick one set and keep it while you test it, first on a demo account. Forward testing on demo shows how to judge those results honestly.
Flicking between charts until one shows the signal you wanted is an easy way to talk yourself into a trade. A fixed set means every trade in your journal was found the same way, so the results can be compared.
Your three charts will sometimes disagree, for example a daily uptrend while the 1-hour chart falls. Reading them in order from the highest down is covered in top-down analysis step by step.
자주 묻는 질문
What is the best timeframe combination for beginners?
No combination is best for everyone. Daily, 4-hour and 1-hour is a common starting set because it needs only a few checks a day and leaves time to think before each order.
How many timeframes should I use?
Two or three is a common choice. A fourth chart often adds more conflicting signals than new information, and the same four to six spacing applies if you use only two.
What ratio should there be between timeframes?
About four to six times between neighbouring charts is a common rule of thumb. It is a convention with little tested evidence behind it, so the nearest chart your platform offers is fine.
Can I use the weekly chart as a trend chart?
Yes, for position trades held for weeks or months. A weekly candle holds about five daily candles, so weekly, daily and 4-hour is a set with ratios of about 5 and 6.
이어서 배우기
 챕터 4Why use more than one timeframe?A timeframe is the period each candle on a chart covers, from one minute to one month. One chart shows only one scale, so a rise on the 15-minute chart can be a small bounce inside a daily downtrend. A higher timeframe gives direction and major levels; a lower one gives detail for timing and stops.
 챕터 4Top-down analysis step by step.Top-down analysis means reading the same pair from the largest chart to the smallest before you trade. The weekly chart sets the direction, the daily chart finds the price zone, and the 4-hour chart times the entry, stop and size. If the charts disagree, you wait.

