How crypto market cycles work.
A crypto market cycle is a full round of rising and falling prices: a quiet base, a strong rally, a peak and then a deep fall. Between 2012 and 2024, Bitcoin's cycles each lasted about four years and lined up with its halvings. That is only three cycles, so the pattern is weak evidence and may not repeat.
เนื้อหานี้ยังมีเฉพาะภาษาอังกฤษ

Picture a coin that sits near $10 for a year, climbs to $100 over the next eighteen months, then falls back to $20 and goes quiet again. The prices are round numbers for illustration.
Traders call a full round like that a market cycle. Bitcoin's past cycles were large and came at fairly regular intervals, which is why the idea is so popular in crypto.
The four phases of a cycle
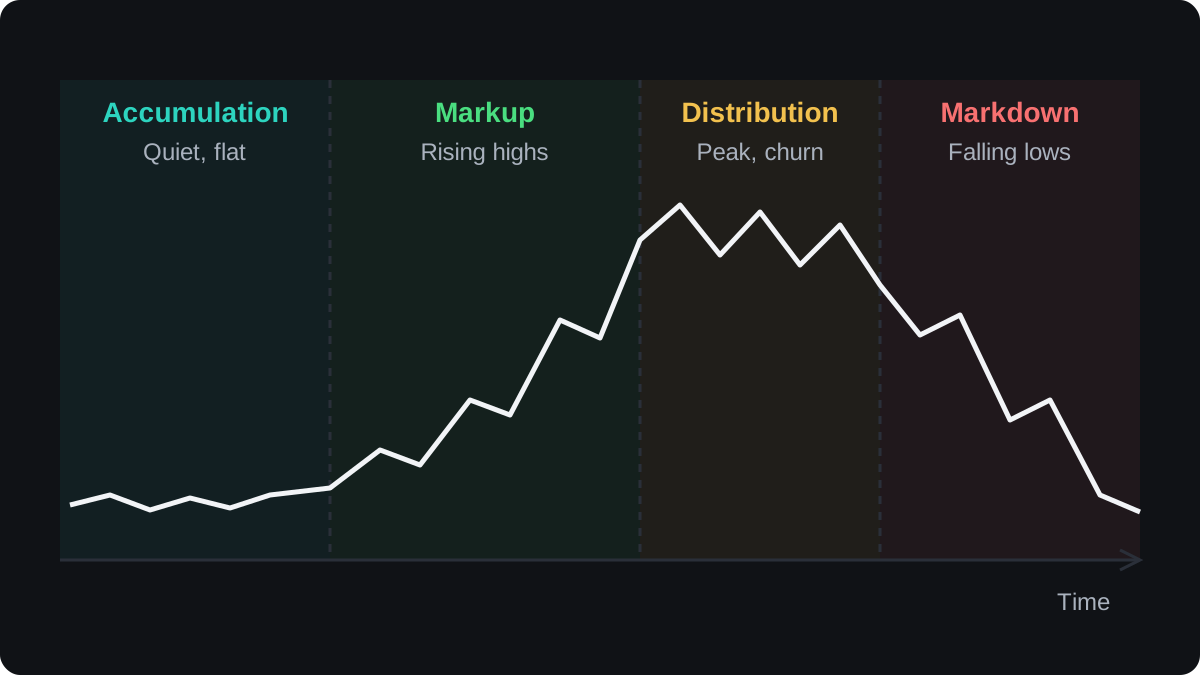
Most descriptions split a cycle into four phases. They are labels for a shape that is easiest to see afterwards, and nobody rings a bell when one phase ends.
In accumulation, prices are low and move sideways after a crash. Trading is thin, and patient buyers slowly collect coins from sellers who have given up.
In the markup phase, prices make higher highs and higher lows. Rising prices draw attention and new buyers, which pushes prices higher still.
In distribution, the rally stalls near a peak. Prices swing hard while early holders sell to late buyers, some of them using borrowed money.
In markdown, prices fall in steps. Traders who borrowed are forced to sell, and the fall slows only when sellers run out.
How the halving got tied to the cycle
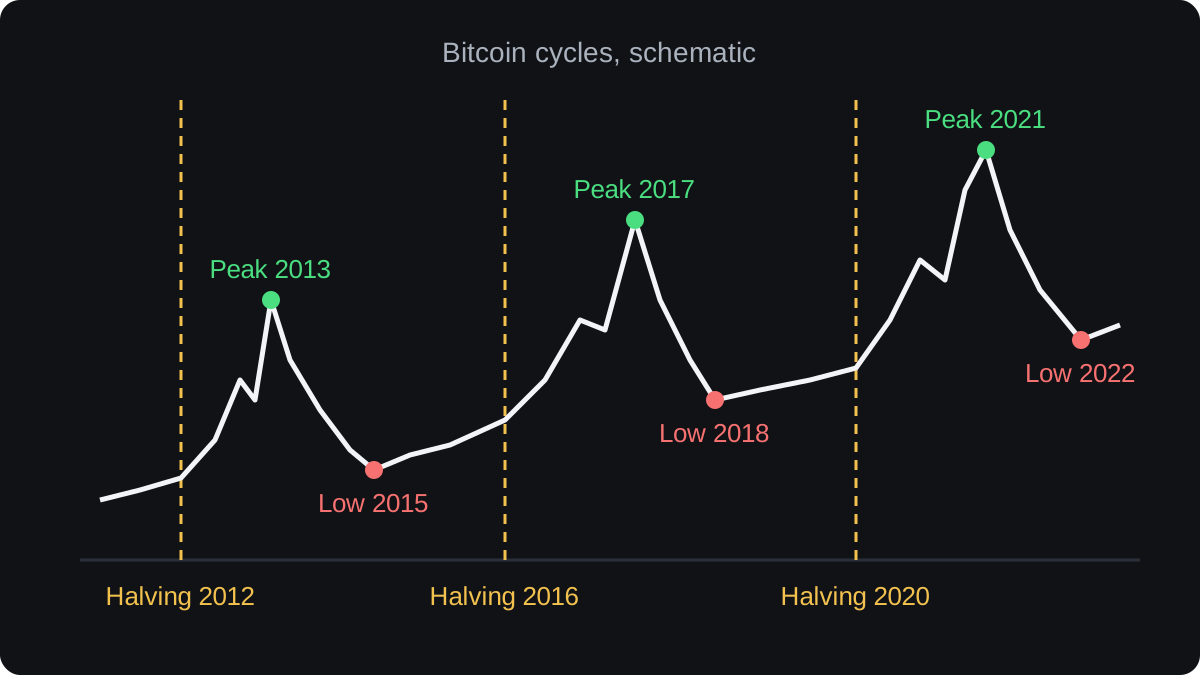
Bitcoin's past peaks came in late 2013, late 2017 and late 2021. Each arrived about 12 to 18 months after a halving, the four-yearly cut in new coins paid to miners.
The lows followed a similar rhythm. Bitcoin bottomed in early 2015, late 2018 and late 2022, each time about a year and a half before the next halving. From peak to low, those falls were roughly 75% to 85%.
The usual explanation starts with the halving, which cuts the steady supply of new coins that miners sell. If demand holds, prices drift up and draw in new buyers, and borrowed money pushes them further until buying runs out.
There is also a feedback loop. Because the four-year pattern is widely known, people trade on it, buying before halvings and selling a year or so after. That behaviour can reinforce the pattern for a while, or pull it earlier.
Other forces that moved with past cycles
The halving never acted alone. The 2020 to 2021 rally came with very low interest rates and large government stimulus. The 2022 fall came as central banks raised rates quickly.
Those links run through money conditions worldwide, which the lessons on global liquidity and crypto and the economy cover.
Failures inside crypto also shaped the falls. In 2022, a large algorithmic stablecoin collapsed, and several crypto lenders and a major exchange went bust, which forced more selling.
Borrowed money works in both directions. Late in a rally, many positions are leveraged, so a modest drop triggers forced selling that can turn into a crash.
Money can also rotate within crypto. The usual story has money moving into Bitcoin first, then into larger altcoins, then into smaller ones.
In both the 2017 and 2021 rallies, altcoins outran Bitcoin for months. Bitcoin's share of the total market, called Bitcoin dominance, fell from above 70% to below 40% each time.
Why three cycles are weak evidence
Between its first four halvings, Bitcoin had three complete cycles that fit the pattern. Three data points are very few. Toss a coin three times, get heads each time, and you still know almost nothing about the coin.
The market has also changed. It is far larger now, and the buyers include funds and companies as well as individuals. Each halving also cuts a smaller amount of new supply than the one before.
The cycle around the 2024 halving broke one habit. In March 2024, weeks before the April halving, Bitcoin set a new record high. In earlier cycles, new records came only after the halving.
US spot Bitcoin ETFs had started trading that January, giving a new group of investors an easy way to buy before the halving.
Even when the pattern holds, its timing is loose. A window of 12 to 18 months spans half a year, and Bitcoin has moved 50% in less time than that.
Using cycle ideas without betting on them
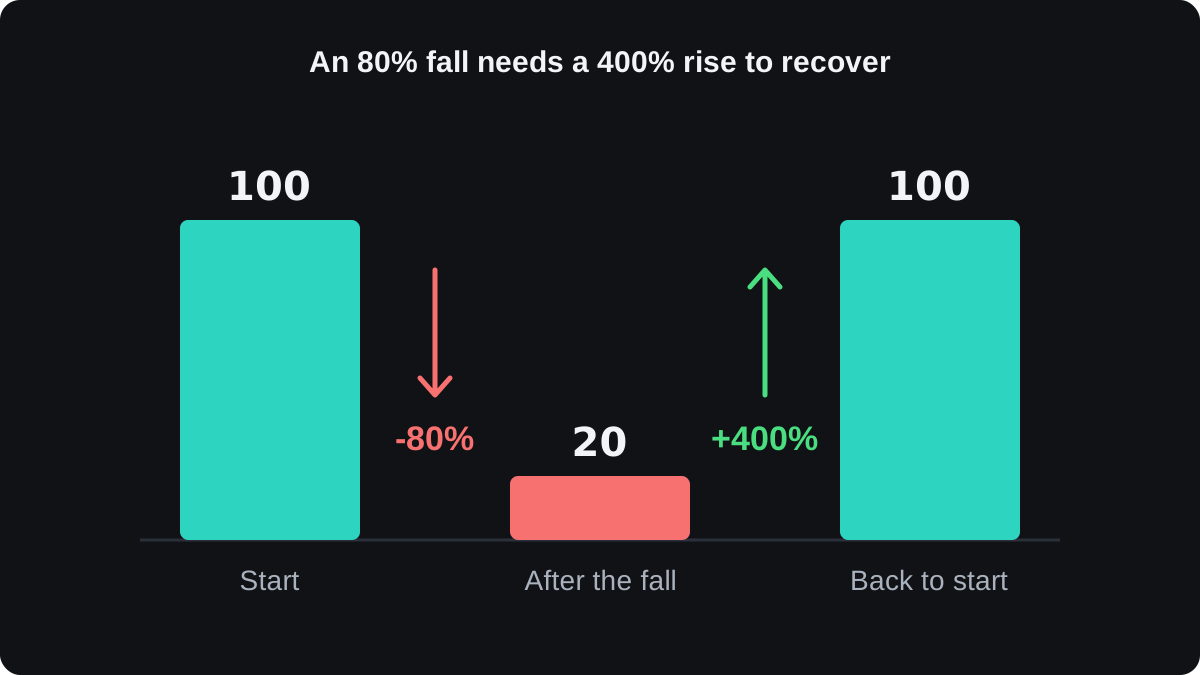
Cycle talk is most useful as a reminder of how deep crypto falls can go. Drawdown maths shows why. The numbers below are round figures for illustration.
- You buy a coin at 100.
- It falls 80%, to 20.
- To get back to 100, it must gain 80 on a base of 20, which is 80 ÷ 20 = 400%.
A 50% fall needs a 100% rise to recover, and an 80% fall needs 400%. The drawdown and recovery lesson works through the same maths for a trading account.
If you use cycle ideas at all, use them for risk. Size each position so that an 80% fall would hurt without ruining you, and decide in advance what would show your cycle view is wrong.
On-chain ratios such as MVRV are often used to label cycle phases. They marked rough zones in the past, with wide error, and they were fitted on the same few cycles.
คำถามที่พบบ่อย
How long is a crypto market cycle?
Between 2012 and 2024, Bitcoin's cycles each lasted about four years, matching the halving schedule. That rests on three cycles, so four years describes the past and makes no promise about the next one.
What is altcoin season?
It is a stretch in which many altcoins rise faster than Bitcoin, so Bitcoin's share of the total market falls. It has tended to come late in bull markets, with timing and size that vary a lot.
How far does crypto fall in a bear market?
Bitcoin's falls after the 2013, 2017 and 2021 peaks were roughly 75% to 85%, and the 2011 crash went deeper, past 90%. Many smaller coins fell further or never recovered, and a future fall could be smaller or larger.
Can anyone predict the top of a cycle?
No method has done it reliably. The halving calendar and on-chain ratios have pointed to rough zones in the past, with wide error and few cycles to test on.
เรียนต่อ
 บทที่ 3What is the Bitcoin halving?The Bitcoin halving is the moment the new bitcoin paid to miners for each block is cut in half. It happens every 210,000 blocks, roughly every four years, and is written into Bitcoin's rules. The payment started at 50 BTC per block in 2009 and fell to 3.125 BTC after the 2024 halving.
 บทที่ 3What is Bitcoin dominance?Bitcoin dominance is Bitcoin's market value as a share of the value of all cryptocurrencies combined. If Bitcoin is worth $1,000 billion and the whole market $2,000 billion, dominance is 50%. Traders use it to see whether money is moving toward Bitcoin or toward other coins, though stablecoins and data choices can distort it.

