What is Bitcoin dominance?
Bitcoin dominance is Bitcoin's market value as a share of the value of all cryptocurrencies combined. If Bitcoin is worth $1,000 billion and the whole market $2,000 billion, dominance is 50%. Traders use it to see whether money is moving toward Bitcoin or toward other coins, though stablecoins and data choices can distort it.

Say the whole crypto market is worth $2,000 billion, and Bitcoin alone is worth $1,000 billion of it. That gives Bitcoin a 50% share, called Bitcoin dominance.
Traders watch it to see whether money is favouring Bitcoin or the rest of the market. All the figures in this lesson are round numbers for illustration.
How Bitcoin dominance is calculated
Start with market cap, short for market capitalisation. For one coin, it is the price times the number of coins in circulation. If Bitcoin trades at $50,000 and 20 million coins circulate, its market cap is $1,000 billion.
Add up the market caps of every coin a data site tracks, and you get the total crypto market cap. Bitcoin dominance is Bitcoin's market cap divided by that total, times 100.
With $1,000 billion for Bitcoin and $2,000 billion for the market, that is 1,000 ÷ 2,000 × 100 = 50%. In this example the other $1,000 billion splits into $800 billion of altcoins and $200 billion of stablecoins.
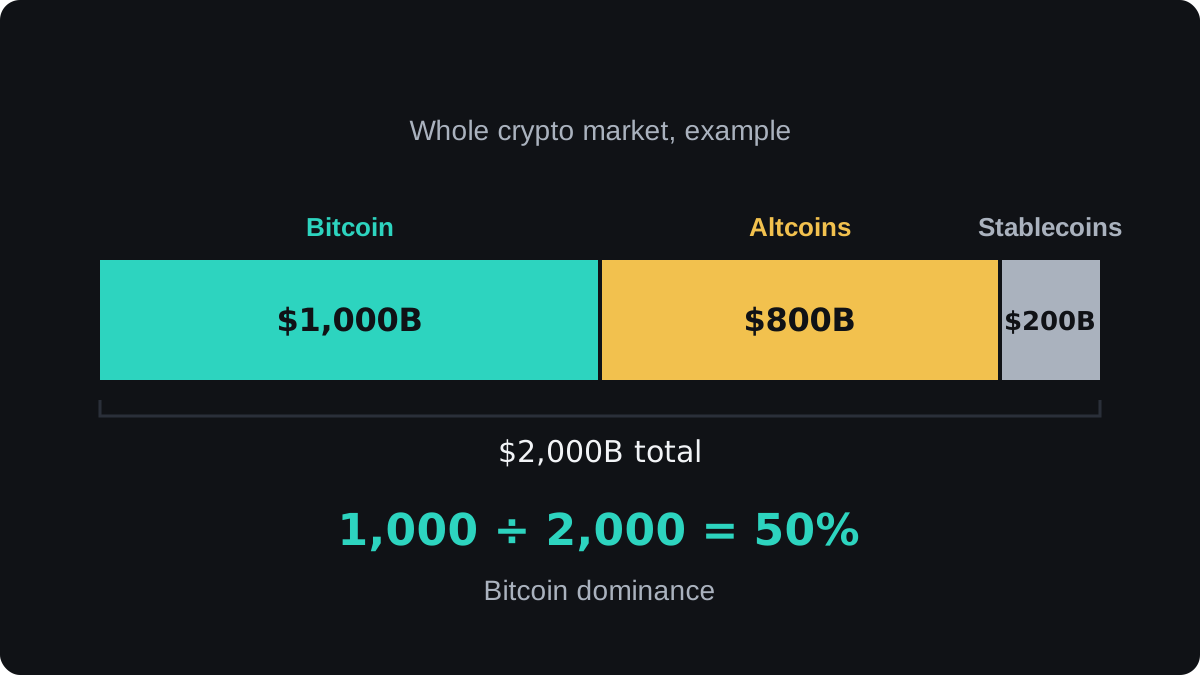
Altcoins here means every coin other than Bitcoin and the stablecoins. Stablecoins are tokens built to hold a steady value, usually one US dollar.
What makes dominance rise or fall
Dominance is a ratio, so it moves when Bitcoin does better or worse than the rest of the market. Bitcoin's price can rise while its dominance falls.
Take the starting market above and change it in three ways:
- Bitcoin rises 20% and nothing else moves. Bitcoin is now $1,200 billion of a $2,200 billion market: 1,200 ÷ 2,200 = 54.5%.
- Altcoins rise 50% and nothing else moves. Altcoins go from $800 billion to $1,200 billion, so all other coins, stablecoins included, come to $1,400 billion and the market to $2,400 billion. Bitcoin's share is 1,000 ÷ 2,400 = 41.7%.
- Both happen together. Bitcoin is $1,200 billion of $2,600 billion, or 46.2%, so dominance falls even though Bitcoin rose 20%.
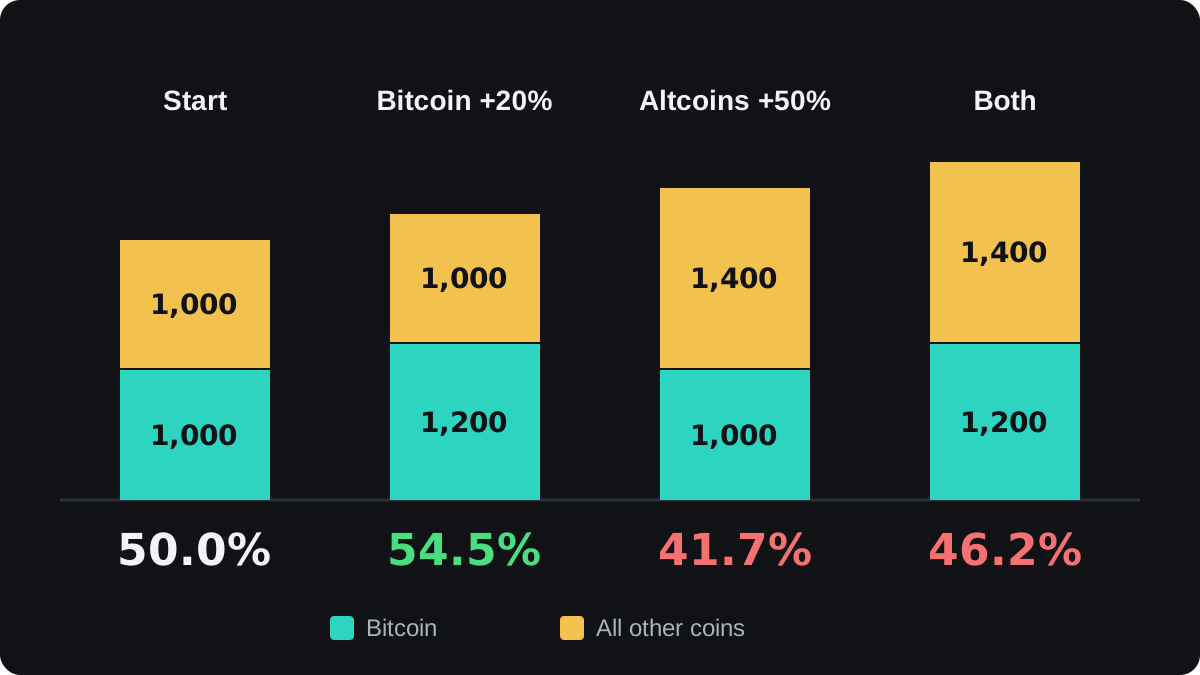
The third case surprises people most. A rising Bitcoin with falling dominance usually means other coins are rising faster.
Why stablecoins distort the reading
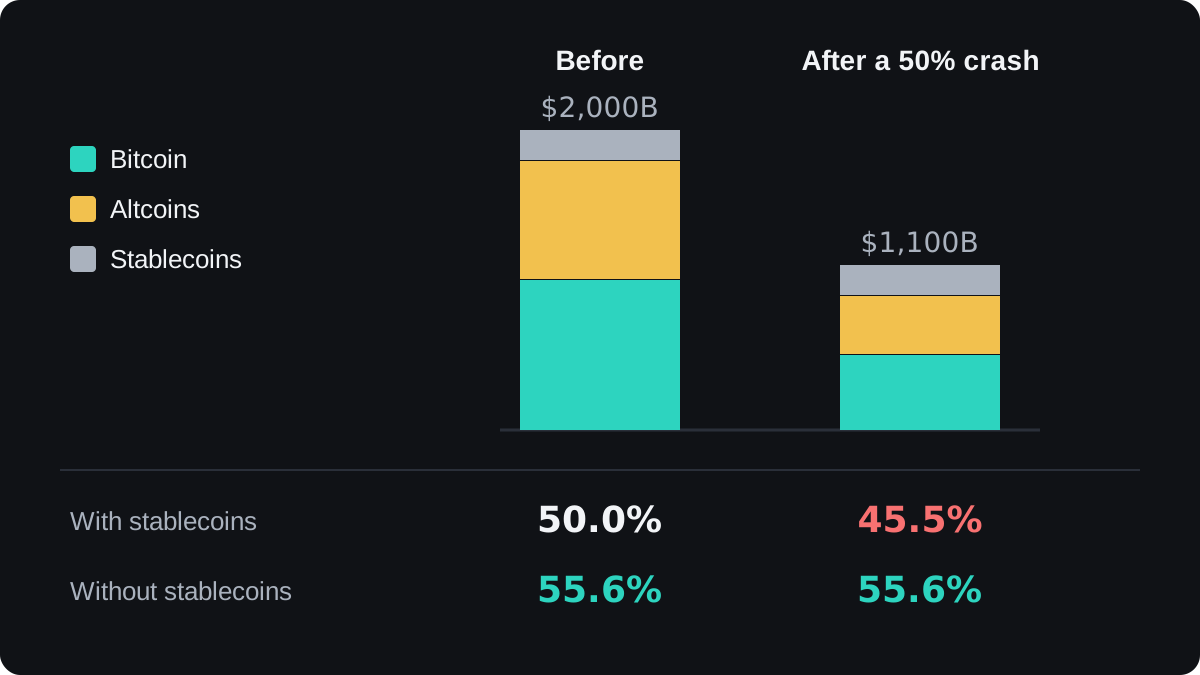
Stablecoins hold their value when everything else falls. That can move dominance in a crash, even when Bitcoin and altcoins fall by exactly the same amount.
Start again from the 50% market and cut Bitcoin and altcoins in half. Bitcoin drops to $500 billion and altcoins to $400 billion, while stablecoins stay at $200 billion. The total is now $1,100 billion.
Bitcoin dominance is now 500 ÷ 1,100 = 45.5%. It fell 4.5 points, yet Bitcoin did exactly as well as altcoins. The whole drop came from stablecoins holding still.
Some charts publish dominance without stablecoins to fix this. Before the crash it is 1,000 ÷ 1,800 = 55.6%, and after it 500 ÷ 900 = 55.6%. That version shows no change, which is the honest answer here.
Other ways the number can mislead
Different data sites track different lists of coins. Each new token they add enlarges the total, so two sites can show dominance a few points apart on the same day.
Market cap also flatters thinly traded coins. A token with 1 billion units at $1 shows a $1 billion market cap, yet selling a small part could crash its price. Liquidity decides what a market cap is really worth.
The coin count itself is an estimate. Bitcoin's circulating supply includes coins that are probably gone for good, such as those in wallets whose owners lost their private keys.
How traders read Bitcoin dominance
Traders read dominance together with price. Each combination says something different about where money is going within crypto.
When Bitcoin rises and dominance rises, money is gathering in Bitcoin. This has often happened early in a rally, or when traders want crypto exposure with less risk than smaller coins carry.
When the market rises and dominance falls, money is rotating into altcoins. A long stretch of this is often called altcoin season, and it has tended to come late in past market cycles.
When dominance falls in a crash, check stablecoins before you conclude anything. As the example showed, a falling market alone can drag the figure down.
Dominance describes what has already happened. It does not forecast, and a trend in it can run for months after it looks stretched.
A useful second view is the ETH/BTC price ratio, which compares ether, the largest altcoin by market cap in most years since 2017, with Bitcoin directly. Stablecoins play no part in it.
Questions
What is a high Bitcoin dominance?
There is no fixed level. Compare a reading with its own history on the same data site, and check whether that site counts stablecoins.
Why does Bitcoin dominance fall when Bitcoin is rising?
Other coins are rising faster. Bitcoin's share of the total shrinks even while its own price climbs.
Does Bitcoin dominance include stablecoins?
On the large market data sites it does, because they count stablecoins in the total crypto market cap. Some charts publish a version without them, which shows rotation between volatile coins more clearly.
Where can I see Bitcoin dominance?
Most crypto market data sites and charting platforms publish it, often under a symbol such as BTC.D. Their figures differ a little because each counts a different list of coins.
Keep learning
 Chapter 3What is the Bitcoin halving?The Bitcoin halving is the moment the new bitcoin paid to miners for each block is cut in half. It happens every 210,000 blocks, roughly every four years, and is written into Bitcoin's rules. The payment started at 50 BTC per block in 2009 and fell to 3.125 BTC after the 2024 halving.
 Chapter 3How crypto market cycles work.A crypto market cycle is a full round of rising and falling prices: a quiet base, a strong rally, a peak and then a deep fall. Between 2012 and 2024, Bitcoin's cycles each lasted about four years and lined up with its halvings. That is only three cycles, so the pattern is weak evidence and may not repeat.

