Technical analysis and price action in crypto.
Technical analysis on crypto uses the same tools as on any chart: trend, support and resistance, candles and indicators. Crypto adds quirks. The market never closes, so the daily candle depends on your platform's settings. Each exchange prints its own price, forced selling leaves long wicks, and moves that span years read better on a log scale.
เนื้อหานี้ยังมีเฉพาะภาษาอังกฤษ
The daily candles of one coin can differ between two platforms. Say one closes its day at midnight UTC and the other at midnight in New York. Neither is wrong, because crypto has no official close.
Technical analysis studies past price and volume to judge where price may go next. Price action trading is the plainest form of it: you read candles and levels with few or no indicators.
Both carry over to crypto with a few adjustments. Every price in this lesson is a round number chosen for illustration.
Does technical analysis work the same on crypto?
The tools are the same. You read trend from swing highs and lows and mark support and resistance as zones, as on any market.
The forex lessons on technical analysis and price action trading cover those basics in full.
Round numbers get extra attention in crypto. Prices run to many digits, and levels such as 50,000 or 1.00 tend to collect orders, so they can act as support or resistance.
The limits carry over too. A chart shows what happened, and no pattern makes the next move certain.
Which candles should you trust?
Because crypto trades all week, the platform chooses when a daily or weekly candle closes. Many use midnight UTC, and some let you pick. Choose one setting and keep it.
Each exchange also prints its own price. A burst of selling on one exchange can draw a long wick there that barely shows elsewhere. Read the chart of the venue where you trade, or an index that averages several venues.
A CFD chart follows your broker's price feed. If a broker pauses crypto trading or widens spreads at weekends, its chart can show gaps and spikes the exchanges never printed. The lesson on trading crypto CFDs at weekends covers this.
Volume needs the same care. Each venue reports only its own trades, and some venues have been found to inflate their numbers. Compare volume within one venue over time, rather than across venues.
Why do crypto charts often use a log scale?
Say a coin rises from 1,000 to 2,000, and years later from 10,000 to 20,000. Both moves double the price, a gain of 100% each.
On a normal linear chart the second move is ten times as tall as the first, because it covers 10,000 of price instead of 1,000.
A log scale spaces prices by percentage. Every doubling takes the same height, so both moves look the same size, and a trend that grows at a steady percentage draws a straight line.
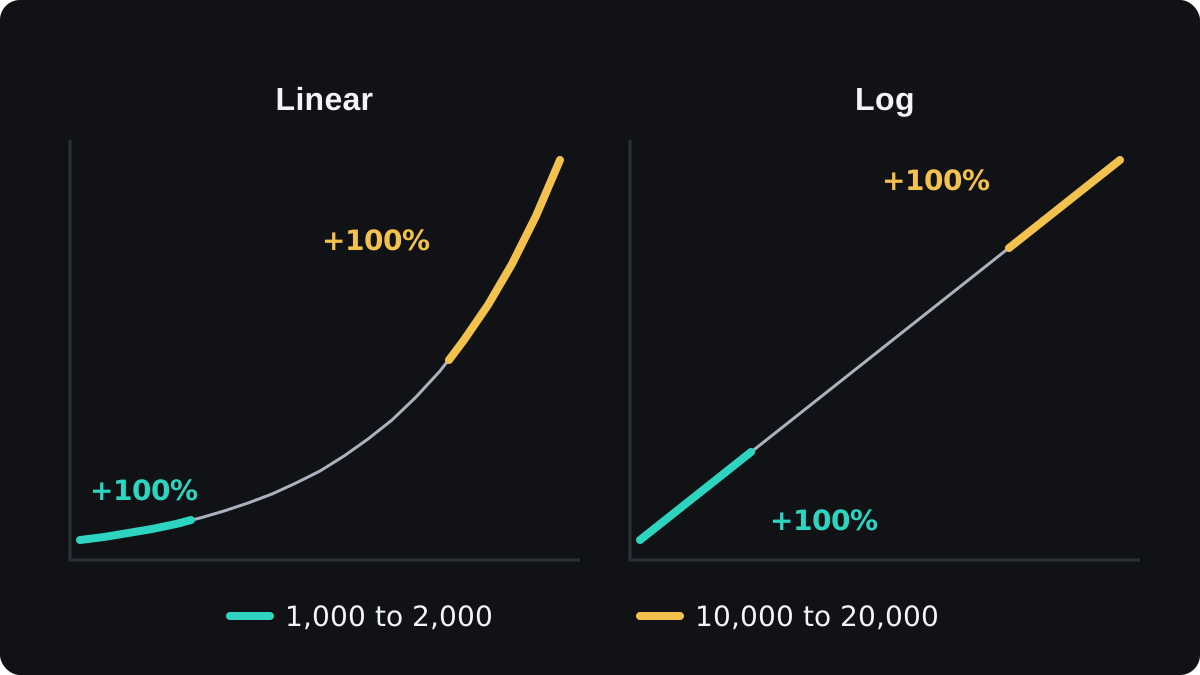
Use a log scale for moves that span months or years. A long trend line drawn on a linear chart can look broken on a log chart, and the other way round. On intraday charts the difference is small.
How do liquidation wicks break levels?
Obvious support collects stop losses just below it. Traders who bought near it with borrowed money also have prices below it where the exchange closes their positions for them.
That forced close is a liquidation: the exchange sells the position because the margin left can no longer cover the loss. When price dips into that band, stops and liquidations turn into market sells at once.
The selling drives price lower for a few minutes. Often buyers then step in and price snaps back, leaving a long lower wick through the level and a close back above it.
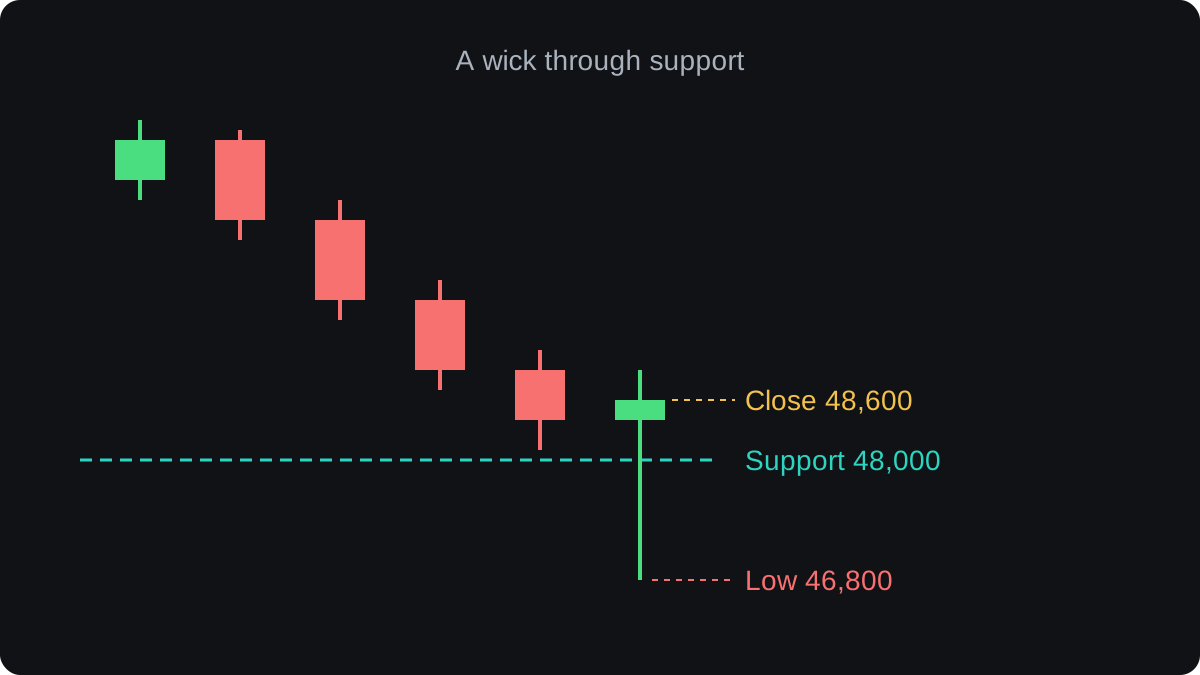
Here support sits at 48,000. One candle trades down to 46,800, triggers the stops below, and closes at 48,600. A stop just under 48,000 was hit, though the level held at the close.
Not every flush reverses. Sometimes the selling keeps going and the level breaks for real, which is why the close matters.
Two habits help. Wait for a candle to close before you treat a level as broken, and place stops beyond the zone with room for the coin's usual swing.
The forex lesson on false breakouts covers the pattern in more detail.
A price action trade plan, step by step
Here is how the pieces fit, on a $10,000 account risking 1% per trade:
- The daily chart shows an uptrend, with higher highs and higher lows.
- An old resistance zone at 48,000 to 48,500 has turned into support.
- Price pulls back into the zone, then a bullish candle closes at 49,000. You buy there.
- The stop goes at 47,500, below the zone with room for a wick. Risk per coin is 1,500.
- The target is the last swing high at 52,000. Reward per coin is 3,000.
- Reward to risk is 3,000 ÷ 1,500, which is 2 to 1.
- Size: $100 ÷ 1,500 = 0.0667 coin, rounded down to 0.066. A full loss is 0.066 × 1,500 = $99, and a win is 0.066 × 3,000 = $198.
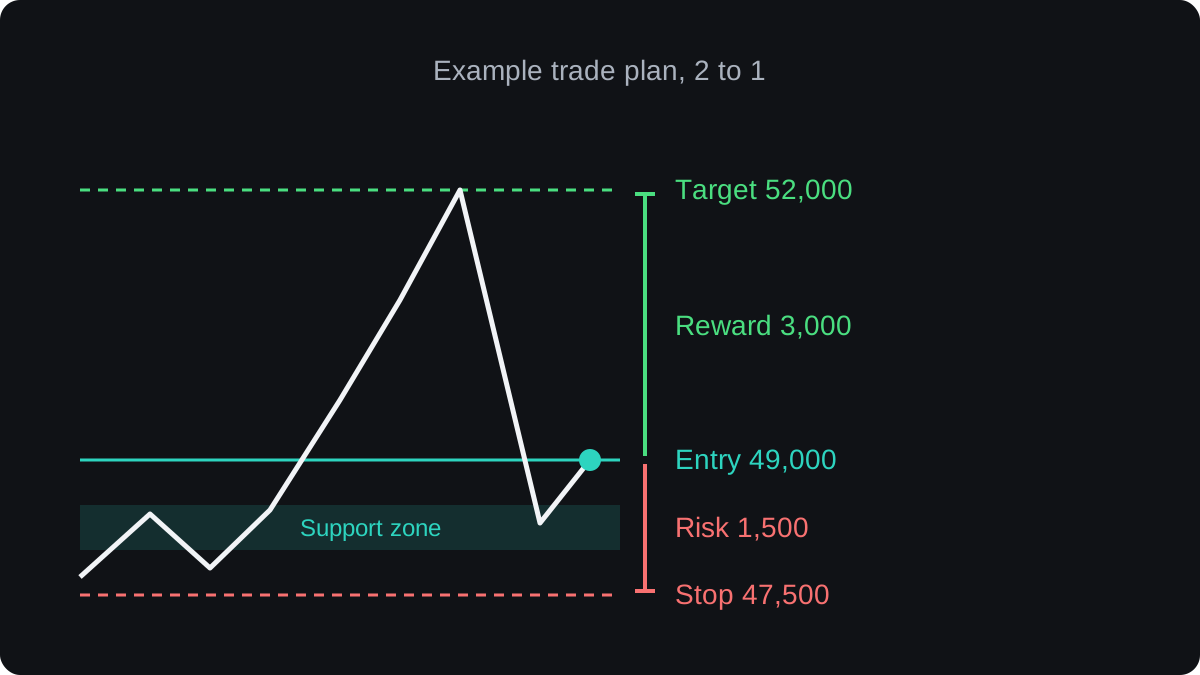
The forex lesson on the risk-reward ratio explains what a 2 to 1 plan needs to win over time. The lesson on sizing a crypto position adds fees to the sum.
Where do crypto charts mislead?
Small coins with thin order books can be pushed around by a few large orders, so their patterns are less reliable. The fewer people trade a coin, the less a chart level means.
News can ignore every level. A hack or a delisting can send a coin straight through support in minutes.
Adding more indicators does not make a chart more reliable. Most are built from the same prices, so five of them agreeing is closer to one signal repeated five times.
Patterns also look clearer in hindsight than they did at the time. Test a rule on past charts and on a demo before you trust it, as the forex lesson on backtesting a strategy explains.
คำถามที่พบบ่อย
Does technical analysis work on crypto?
The same tools apply, and because many traders watch the same levels, those levels can matter. No chart method predicts price reliably, and crypto adds news shocks and thin markets that break patterns.
What time does the daily crypto candle close?
It depends on the platform. Many use midnight UTC and some let you pick a time zone, so check the setting before you compare charts.
Should I use a log or linear chart for crypto?
Use a log chart for moves that span months or years, because it shows equal percentage moves at equal height. On intraday charts the two look almost the same.
Why do crypto charts have such long wicks?
Stops and leveraged positions cluster near obvious levels. When price reaches them, forced selling or buying pushes it further for a moment. When price then snaps back, it leaves a long wick.
เรียนต่อ
 บทที่ 1How to do fundamental analysis on crypto.Fundamental analysis on crypto studies what could give a coin lasting demand. Most coins have no earnings, so you look at what the network does, who pays to use it, how its supply will grow, whether the token captures any fees and who controls the project. It helps you judge value and dilution, and it is weak at timing.
 บทที่ 1Does the economy drive crypto prices?Partly. Interest rates, the amount of money in the financial system, investors' appetite for risk and the US dollar all reach crypto prices, often through the same channels that move technology shares. How strong those links are changes over time, and crypto's own events, such as hacks or new products, can outweigh them for months.

