What is the MVRV Z-score?
The MVRV Z-score measures how far a coin's market cap sits above or below its realized cap, in units of the standard deviation of market cap over its history. The formula is market cap minus realized cap, divided by that standard deviation. High readings mean an unusually stretched market; readings below 0 mean price is under the average on-chain cost.
เนื้อหานี้ยังมีเฉพาะภาษาอังกฤษ

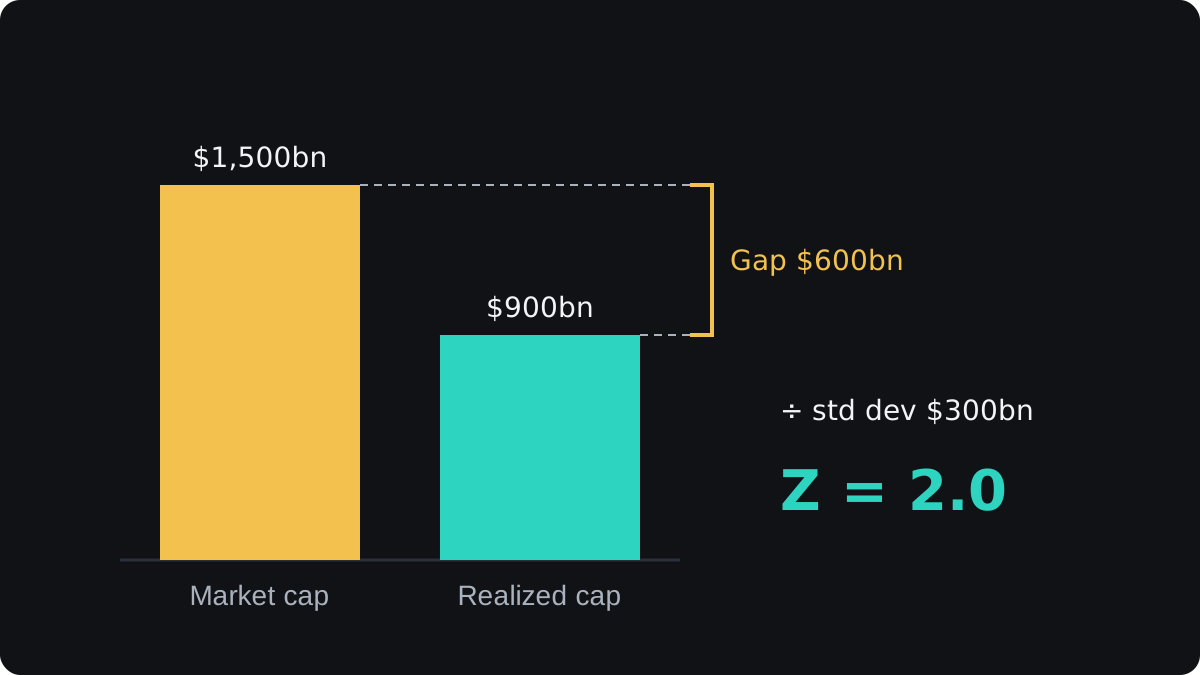
Imagine a coin with an illustrative market cap of $1,500 billion and a realized cap of $900 billion. The gap between them is $600 billion. Is that a big gap?
It depends on how much market cap usually swings. Say the standard deviation of market cap over the coin's history is $300 billion.
The gap is then $600 billion ÷ $300 billion = 2 standard deviations. That gives an MVRV Z-score of 2.0.
The formula
The MVRV Z-score is (market cap minus realized cap) ÷ the standard deviation of market cap. In the usual version, the standard deviation is taken over all the market cap history available.
Market cap and realized cap are the same two inputs as MVRV. MVRV divides one cap by the other. The Z-score subtracts them and then divides the gap by a measure of how much market cap moves.
Standard deviation measures how spread out a set of numbers is around its average. The lesson on measuring volatility applies it to prices; here it is applied to the history of market cap values.
Worked example
These numbers are illustrative.
- Market cap = $1,500 billion, and realized cap = $900 billion.
- Gap = $1,500 billion minus $900 billion = $600 billion.
- Standard deviation of market cap = $300 billion.
- Z-score = $600 billion ÷ $300 billion = 2.0.
- For comparison, MVRV = $1,500 billion ÷ $900 billion = 1.67.
Now let price fall so that market cap drops to $800 billion, with realized cap still at $900 billion. The gap is -$100 billion, and the Z-score is -$100 billion ÷ $300 billion = -0.33.
Reading the Z-score
The Z-score is above 0 when market cap is above realized cap, and below 0 when it is under. The zero line is the same point as an MVRV of 1, where holders as a group are at breakeven.
The higher the score, the further market value has run ahead of the price holders paid, measured against how much market cap normally moves.
On Bitcoin, the highest readings came near past cycle peaks, and readings below 0 came near past cycle lows.
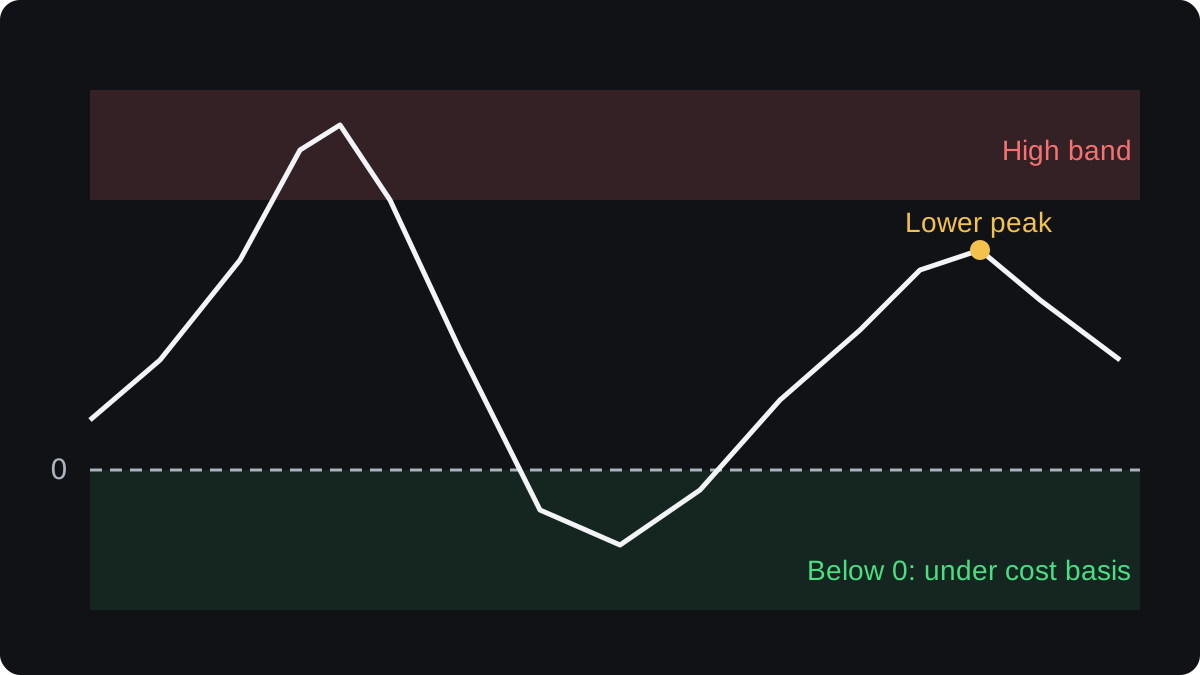
Popular charts shade a high band and a low band. Their edges are conventions fitted to past cycles, so they are rules of thumb.
Past peaks have reached different heights. A top can therefore form without the score ever reaching the high band.
Why traders use a Z-score at all
A plain gap in dollars means little across a long history. A $600 billion gap would be enormous for a small market and modest for a large one.
Dividing by the standard deviation turns the gap into a number you can compare across time, at least in principle.
That makes the Z-score a measure of how unusual today's valuation is. Traders read it next to MVRV, NUPL and price, as background for where the market might sit in its cycle.
Where the Z-score misleads
The denominator changes over time. A standard deviation taken over all history tends to grow as market cap grows and swings, so the same gap tends to give a smaller score later on.
Say the gap is $600 billion in two different periods. Early on, with a standard deviation of $200 billion, the score is $600 billion ÷ $200 billion = 3.0.
Years later, with a standard deviation of $400 billion, the same gap scores $600 billion ÷ $400 billion = 1.5.
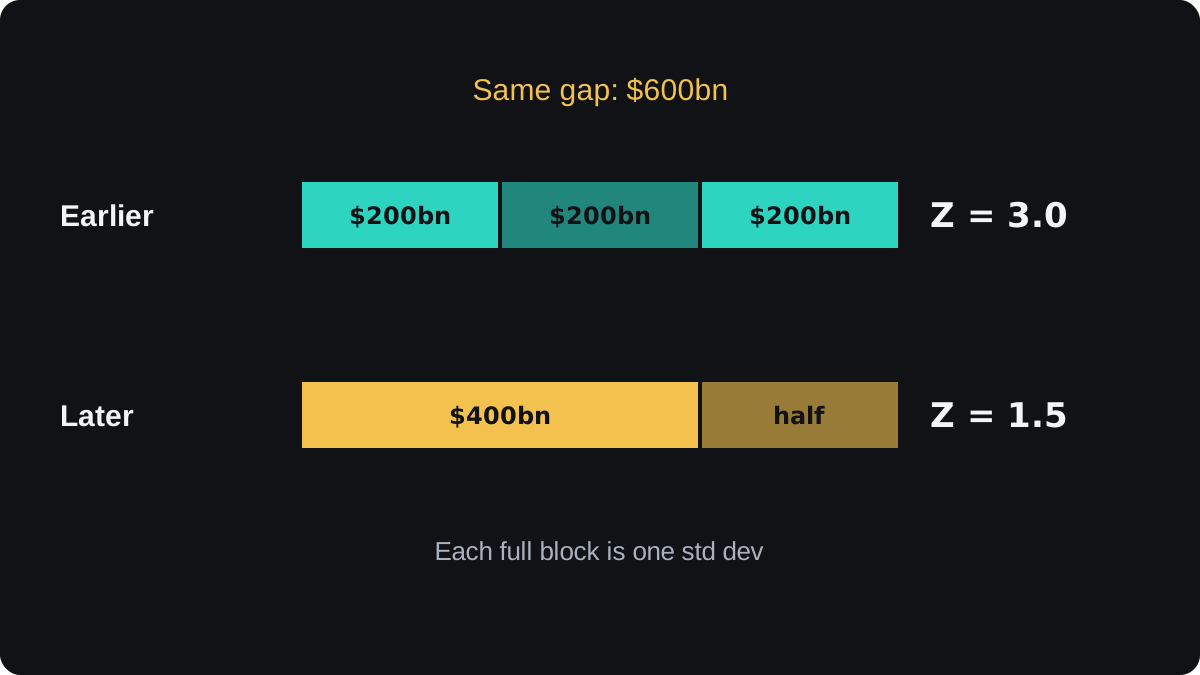
That drift is one reason a band that fitted early peaks may never be reached again. The market's makeup has changed too, with ETFs and custodians now holding coins for many investors.
Versions also differ. Providers can measure the standard deviation over different periods, and their realized caps differ because they label wallets and treat internal transfers and lost coins in different ways. Check which version a chart uses before you compare levels.
Like every on-chain metric, the Z-score describes positioning and does not time trades. It can sit high for months and stay below 0 while price falls further, so keep your risk management in charge of each trade.
คำถามที่พบบ่อย
What is a high MVRV Z-score?
A high score means market cap sits far above realized cap compared with how much market cap usually moves. No fixed level marks a top, and the scale has shifted as the market has grown.
Can the MVRV Z-score be negative?
Yes. It is negative whenever market cap is below realized cap, which is the same as MVRV under 1.
How is the MVRV Z-score calculated?
Subtract realized cap from market cap, then divide by the standard deviation of market cap over the chosen history. With a gap of $600 billion and a standard deviation of $300 billion, the score is 2.0.
Why do different websites show different Z-score values?
They estimate realized cap in different ways and may measure the standard deviation over different periods. The shape of the line is usually similar, while the levels differ.
เรียนต่อ
 บทที่ 2What is on-chain analysis?On-chain analysis is the study of a blockchain's public records, such as transfers, balances and the age of coins, to see how holders behave. Data providers turn raw transactions into metrics like exchange flows and realized price. It adds context about supply and holder profit, but it cannot tell you when to trade.
 บทที่ 2Spot volume and volume delta.Spot volume is the amount of a coin traded for immediate delivery over a period. Volume delta splits that volume by who started each trade: volume from market buy orders minus volume from market sell orders. A positive delta means buyers were the more aggressive side, which is different from saying there were more buyers.
 บทที่ 2Exchange flows and exchange balances.Exchange flows track coins moving onto and off known exchange addresses. Inflows arrive, outflows leave, and netflow is inflow minus outflow. Exchange balance is the total held at those addresses, often shown as a share of supply. Rising balances can mean coins ready to sell, but every figure depends on how well a provider labels exchange wallets.
 บทที่ 2What is on-chain cost basis?On-chain cost basis estimates what holders paid by valuing each coin at the price on the day it last moved on the blockchain. Add those values up and divide by the supply, and you get the realized price, the average cost of the whole market. Split by coin age, it gives a separate cost for short-term and long-term holders.
 บทที่ 2What is SOPR?SOPR, the spent output profit ratio, compares what coins were worth when spent on-chain with what they were worth when last received. Above 1 means the coins that moved were spent at a profit on average; below 1 means at a loss. Traders watch how SOPR behaves around 1 to see whether holders are taking profits or giving up.
 บทที่ 2What is NUPL?NUPL, net unrealized profit and loss, measures how much paper profit or loss all holders of a coin are sitting on, as a share of market cap. It equals market cap minus realized cap, divided by market cap. A positive reading means holders are in profit overall; a negative one means the market trades below its on-chain cost basis.
 บทที่ 2What is MVRV, and how do traders read it?MVRV, market value to realized value, divides a coin's market cap by its realized cap, which values each coin at the price when it last moved. A reading of 1.25 means holders are up 25% on average, and below 1 means they are at a loss. Traders use MVRV and its holder-age versions to judge how stretched valuations are.

