Spot volume and volume delta.
Spot volume is the amount of a coin traded for immediate delivery over a period. Volume delta splits that volume by who started each trade: volume from market buy orders minus volume from market sell orders. A positive delta means buyers were the more aggressive side, which is different from saying there were more buyers.
เนื้อหานี้ยังมีเฉพาะภาษาอังกฤษ

Say an exchange reports that 500 BTC changed hands in the last hour. In 300 BTC of those trades, a buyer used a market order and paid the ask.
In the other 200 BTC, a seller used a market order and hit the bid. The hour's volume is 500 BTC, and its volume delta is 300 minus 200 = +100 BTC.
What spot volume measures
Spot volume is the total amount of a coin traded for immediate delivery over a period, such as a day. The word spot separates it from futures, perpetual swaps and crypto CFDs, where traders exchange contracts instead of coins.
Volume can be counted in coins or in money. At an illustrative price of $50,000 per bitcoin, 500 BTC is $25 million of spot volume.
Most spot volume trades inside the books of centralised exchanges, so it never appears on the blockchain. Even at their 2025 peak, decentralised exchanges handled about a quarter of spot volume, by CoinGecko's count.
Trades on decentralised exchanges do settle on-chain. Spot volume sits on on-chain dashboards because traders read it next to chain data.
A price rise on rising spot volume suggests broad participation. A rise on thin volume means fewer coins changed hands to move the price, which often happens when liquidity is low.
Buyers, sellers and the aggressor
Every trade has a buyer and a seller, so buy volume and sell volume are always equal. Volume delta looks at something else: which side started the trade.
On an order book, limit orders rest at set prices and wait. Their owners are the makers.
A trader who sends a market order takes that resting liquidity and is the taker, also called the aggressor. The lesson on maker and taker fees covers the same two roles.
A taker buy fills against resting sell orders at the ask. A taker sell fills against resting buy orders at the bid.
Exchange trade feeds usually carry a flag for this, coded differently by each exchange: some mark the taker's side, others the maker's. Delta is built from that flag.
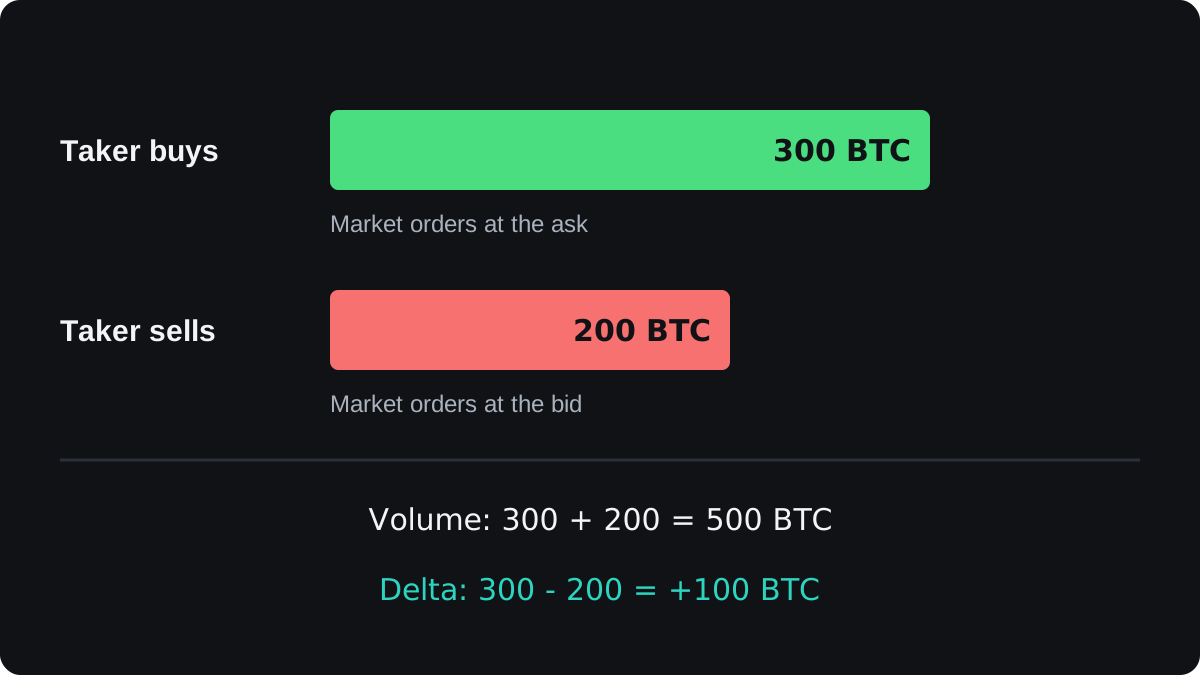
Volume delta is taker buy volume minus taker sell volume over a period. A positive delta means buyers were more willing to pay the spread. A negative delta means sellers were in more of a hurry.
Cumulative volume delta: a worked example
Cumulative volume delta (CVD) is the running total of delta, bar after bar. It shows whether aggressive buying or aggressive selling has dominated over a stretch of time.
Here are four illustrative hourly bars:
| Hour | Taker buys | Taker sells | Delta | CVD |
|---|---|---|---|---|
| 1 | 300 BTC | 200 BTC | +100 | +100 |
| 2 | 250 BTC | 200 BTC | +50 | +150 |
| 3 | 170 BTC | 200 BTC | -30 | +120 |
| 4 | 280 BTC | 200 BTC | +80 | +200 |
Total volume over the four hours is 1,800 BTC: 1,000 BTC of taker buys and 800 BTC of taker sells. The CVD ends at 1,000 minus 800 = +200 BTC, which matches the last row.
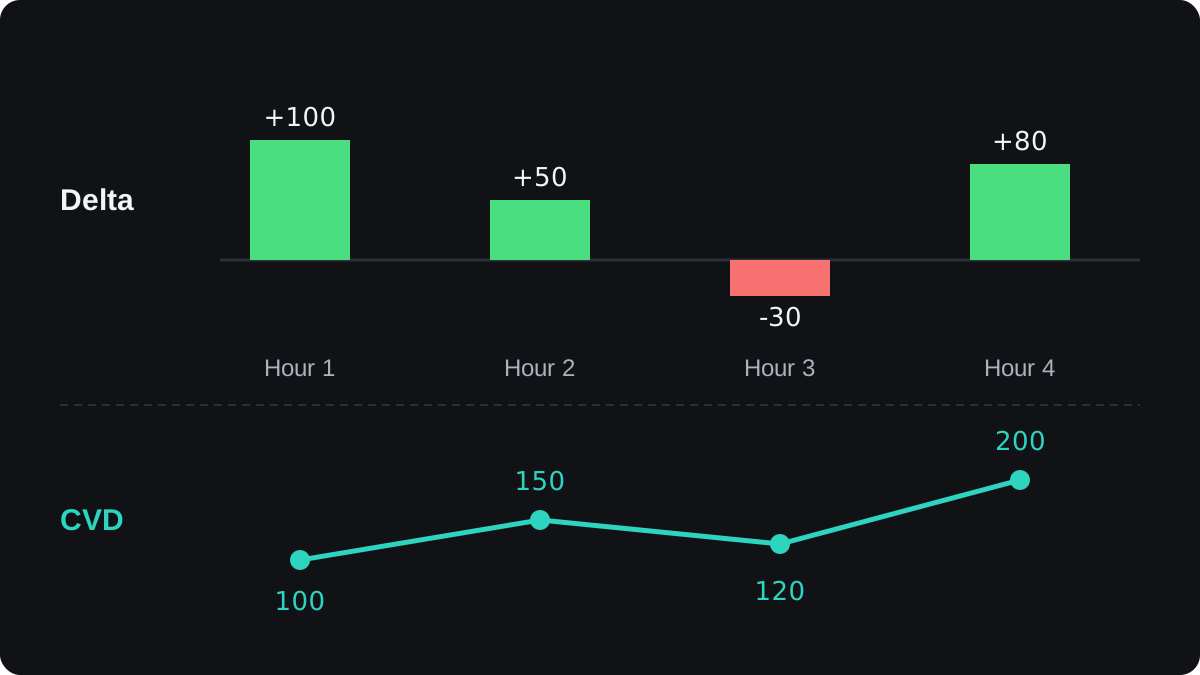
The starting point of CVD is arbitrary. Only its direction and shape matter, so two charts that start counting on different days show different levels for the same market.
How traders read volume and delta
Traders compare delta with what price did. Strong positive delta with a rising price is the plain case: buyers are lifting price with market orders.
The mismatches say more. If CVD climbs while price stays flat, large resting sell orders are probably absorbing the buying.
If price makes a higher high while CVD makes a lower high, fewer aggressive buyers took part in the second push. That is a form of divergence.
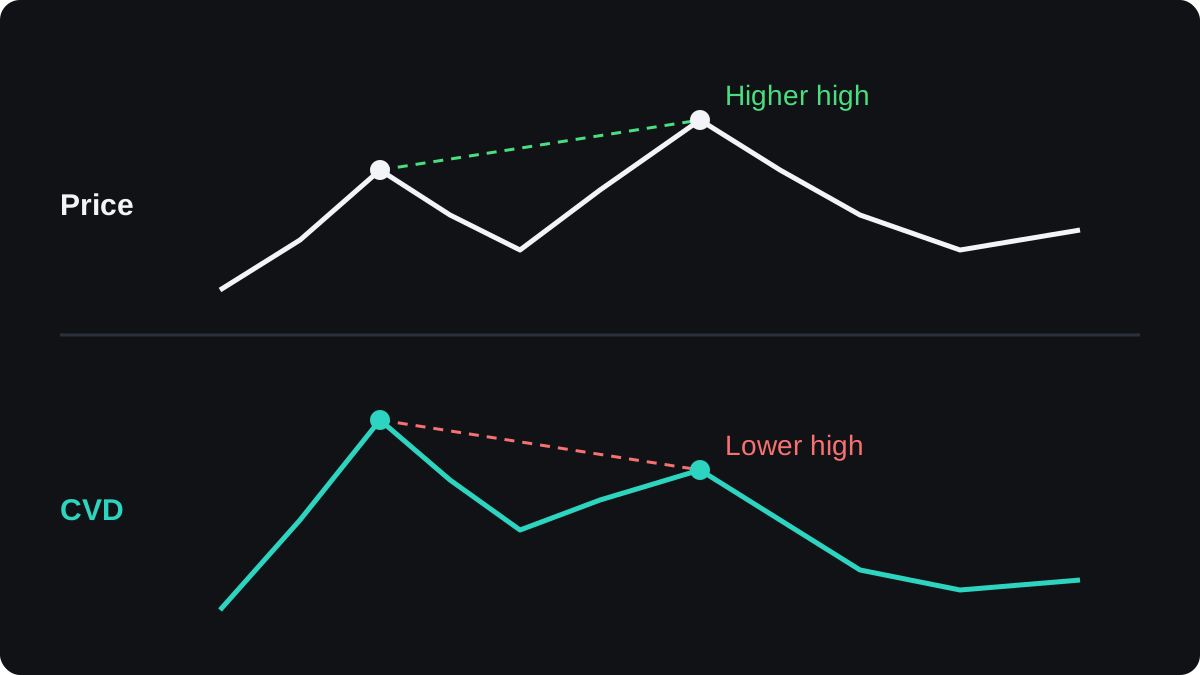
Spot and futures delta are often compared too. A rally where futures CVD rises and spot CVD stays flat suggests the buying comes mostly from leveraged positions. Those can unwind quickly when price turns.
Where volume and delta mislead
Reported volume is not always real. Some venues have inflated their numbers with wash trading, where one party trades with itself. Data providers filter venues in different ways, so their spot volume totals rarely match.
Delta also depends on which venues a provider adds together. If takers buy on a few big exchanges and sell on many small ones, a feed of the big venues and a feed of dozens can show opposite deltas.
Decentralised exchange volume has its own version of the problem. It depends on which contract addresses a provider has labelled as trading pools, and the label lists differ.
Quote currencies split the picture as well. BTC traded against US dollars and BTC traded against stablecoins are separate order books, and some charts show only one of them.
Delta also says nothing about who holds the coins afterwards. A taker buy can be a short seller closing a position.
Read volume and delta as one input next to price structure and your risk plan, never as an entry signal on their own.
คำถามที่พบบ่อย
Is spot volume an on-chain metric?
Most of it is not. Trades on centralised exchanges are recorded in each exchange's own database, and only deposits and withdrawals reach the chain. Trades on decentralised exchanges do settle on-chain.
What does a negative volume delta mean?
More volume traded through market sell orders than market buy orders in that period. Sellers were in more of a hurry, though the price may still have held if buyers were waiting with limit orders.
What is the difference between volume delta and CVD?
Volume delta covers one bar, such as one hour. CVD adds up the delta of every bar from a chosen starting point, so it shows the trend in aggression over time.
Why does spot volume differ between websites?
Each site chooses which exchanges and trading pairs to include, and some remove venues they suspect of fake volume. The totals depend on those choices.
เรียนต่อ
 บทที่ 2What is on-chain analysis?On-chain analysis is the study of a blockchain's public records, such as transfers, balances and the age of coins, to see how holders behave. Data providers turn raw transactions into metrics like exchange flows and realized price. It adds context about supply and holder profit, but it cannot tell you when to trade.
 บทที่ 2Exchange flows and exchange balances.Exchange flows track coins moving onto and off known exchange addresses. Inflows arrive, outflows leave, and netflow is inflow minus outflow. Exchange balance is the total held at those addresses, often shown as a share of supply. Rising balances can mean coins ready to sell, but every figure depends on how well a provider labels exchange wallets.
 บทที่ 2What is on-chain cost basis?On-chain cost basis estimates what holders paid by valuing each coin at the price on the day it last moved on the blockchain. Add those values up and divide by the supply, and you get the realized price, the average cost of the whole market. Split by coin age, it gives a separate cost for short-term and long-term holders.
 บทที่ 2What is SOPR?SOPR, the spent output profit ratio, compares what coins were worth when spent on-chain with what they were worth when last received. Above 1 means the coins that moved were spent at a profit on average; below 1 means at a loss. Traders watch how SOPR behaves around 1 to see whether holders are taking profits or giving up.
 บทที่ 2What is NUPL?NUPL, net unrealized profit and loss, measures how much paper profit or loss all holders of a coin are sitting on, as a share of market cap. It equals market cap minus realized cap, divided by market cap. A positive reading means holders are in profit overall; a negative one means the market trades below its on-chain cost basis.
 บทที่ 2What is MVRV, and how do traders read it?MVRV, market value to realized value, divides a coin's market cap by its realized cap, which values each coin at the price when it last moved. A reading of 1.25 means holders are up 25% on average, and below 1 means they are at a loss. Traders use MVRV and its holder-age versions to judge how stretched valuations are.
 บทที่ 2What is the MVRV Z-score?The MVRV Z-score measures how far a coin's market cap sits above or below its realized cap, in units of the standard deviation of market cap over its history. The formula is market cap minus realized cap, divided by that standard deviation. High readings mean an unusually stretched market; readings below 0 mean price is under the average on-chain cost.

