False breakouts and how to trade them.
A false breakout is a move through support or resistance that fails and returns inside the old range, often leaving a long wick. A common way to trade one is to wait for a close back inside, sell or buy back toward the range, and set a stop just beyond the failed break's extreme. It loses when the break proves real.
เนื้อหานี้ยังมีเฉพาะภาษาอังกฤษ

EUR/USD has bounced between 1.08000 and 1.08600 all day. An hourly candle pushes up to 1.08750, buyers pile in, and by the close the price is back at 1.08500. That move was a false breakout.
A false breakout, often called a fakeout, is a move through a support or resistance level that fails to hold and returns inside the old range. The lesson on trading breakouts dealt with breaks that keep going. This one deals with breaks that reverse.
What does a false breakout look like?
It starts with a range, a stretch where price keeps turning at the same two levels. In the example, resistance sits at 1.08600 and support at 1.08000, 60 pips apart.
The break candle trades up to 1.08750, 15 pips above resistance. It then falls and closes at 1.08500, 10 pips back inside the range. The long upper wick is the visible mark of the failure.
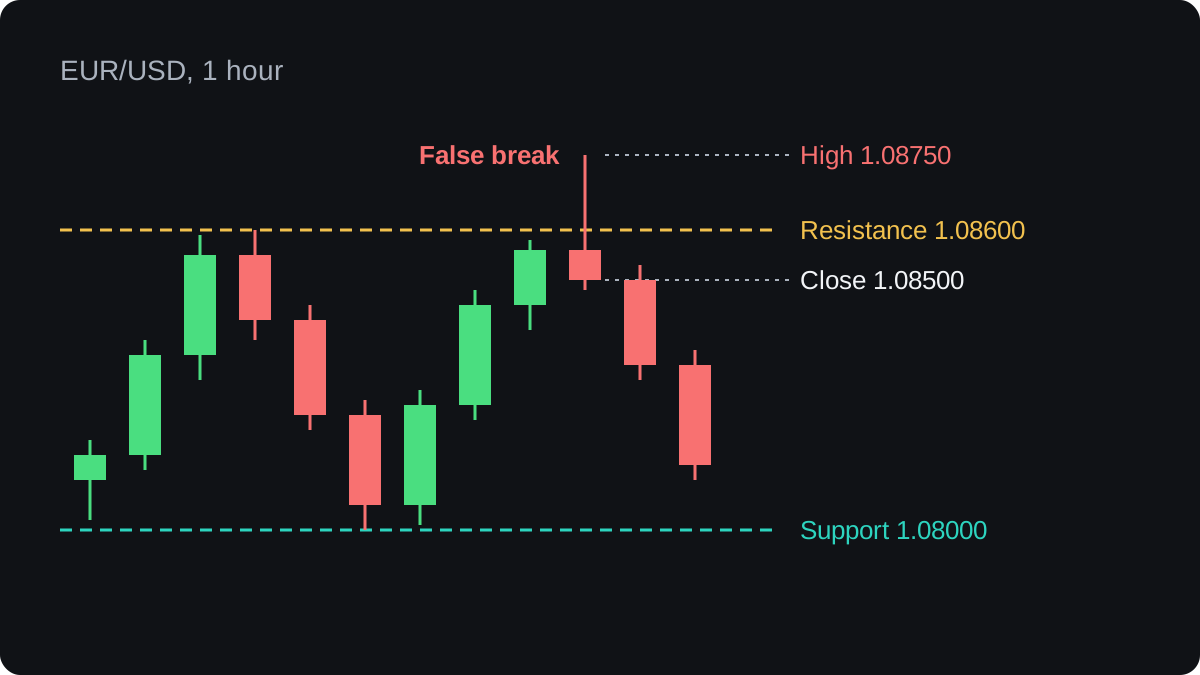
The same thing happens at support, upside down. Price drops below the floor, meets buyers and closes back above it. Traders call that a false breakdown.
A break is only false in hindsight. While the candle is still open at 1.08750, nobody knows whether it will close there or fall back, so the close carries most of the information.
Why do breakouts fail?
There is no reliable figure for how often breakouts fail. The answer changes with the market and with how you define a break, so treat any confident percentage with suspicion.
The mechanism is easier to describe. Obvious levels gather orders. Traders who sold near resistance tend to put their stop losses just above it, and breakout traders put buy stop orders in the same place.
When price reaches that cluster, those buy orders fill at once. The burst of buying can carry price through the level for a short time, then fade once the orders are used up.
Every one of those buyers needs a seller. A trader who wants to sell in size finds plenty of buyers at such a level, which makes it a convenient place to fill a large order.
If no fresh buying follows, price drifts back into the range. This is often called stop hunting, a phrase that implies someone planned it. A chart cannot prove intent, and the same pattern appears when nobody planned anything.
Quiet hours make failures easier. In thin trading, such as the hours between the New York close and the Tokyo open, a modest order can push price through a level that it cannot hold.
News is the other common trigger. A data release on the economic calendar can spike price through a level in seconds, and that first spike sometimes reverses once the market has digested the numbers.
How can you tell a real break from a false one?
No check tells you for certain. The ones traders use may tilt the odds a little, and each has a cost.
Where the candle closes
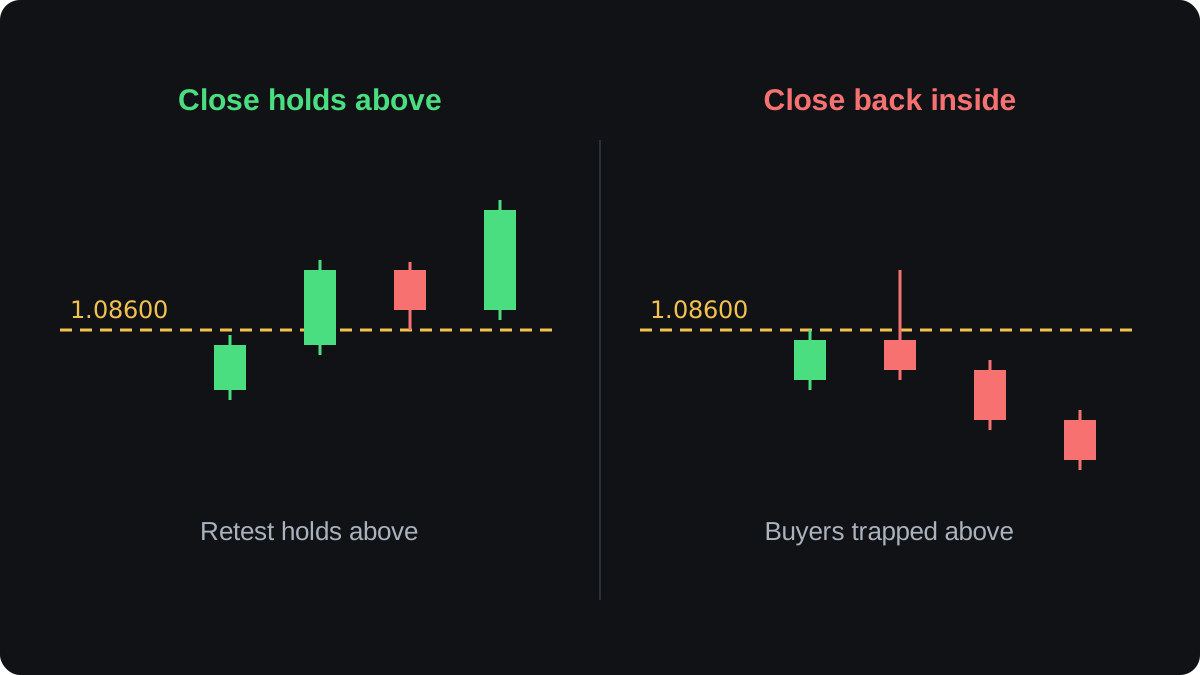
A wick through a level is weaker evidence than a close through it. A common rule is to wait for a candle to close beyond the level. The cost of waiting is a later, worse entry when the break is real.
Whether a retest holds
After a real break, price may come back to the old level and turn away from it, with old resistance now holding as support. If price instead falls straight back through the level, the break is in trouble.
How far past the level price went
Some rules demand a buffer, for example 10 or 20 pips, before a level counts as broken. Small pokes past a level are common and say little, which is why it helps to think of levels as zones.
None of these checks has strong published evidence behind it as a stand-alone filter. Each removes some false signals and lets others through, so judge them on your own tested results.
How do traders turn a failed break into a setup?
The fakeout setup takes the other side of the failed move. If price breaks above resistance and closes back inside, the trader sells. If it breaks below support and closes back inside, the trader buys.
The rules below are one example of how the setup is built, for study:
- Mark a range where price has turned at least twice at each edge.
- Wait for a candle to trade beyond one edge and then close back inside.
- Enter back toward the range at that close, or on the next candle.
- Place the stop a few pips beyond the false break's extreme.
- Aim for the middle of the range or just short of the far edge.
The fakeout's extreme gives the trade one clear point of failure. If price goes back beyond it, the idea that the break failed was wrong, and the stop closes the trade.
The setup also has a reason behind it. Traders who bought the break are now losing, and if they sell to get out, their exits push price further back into the range, though only if they do give up.
A worked false breakout trade
Here is the trade from the first chart, with round illustrative prices. The account holds $5,000 and risks 1% per trade. The chart shows bid prices, as most charts do.
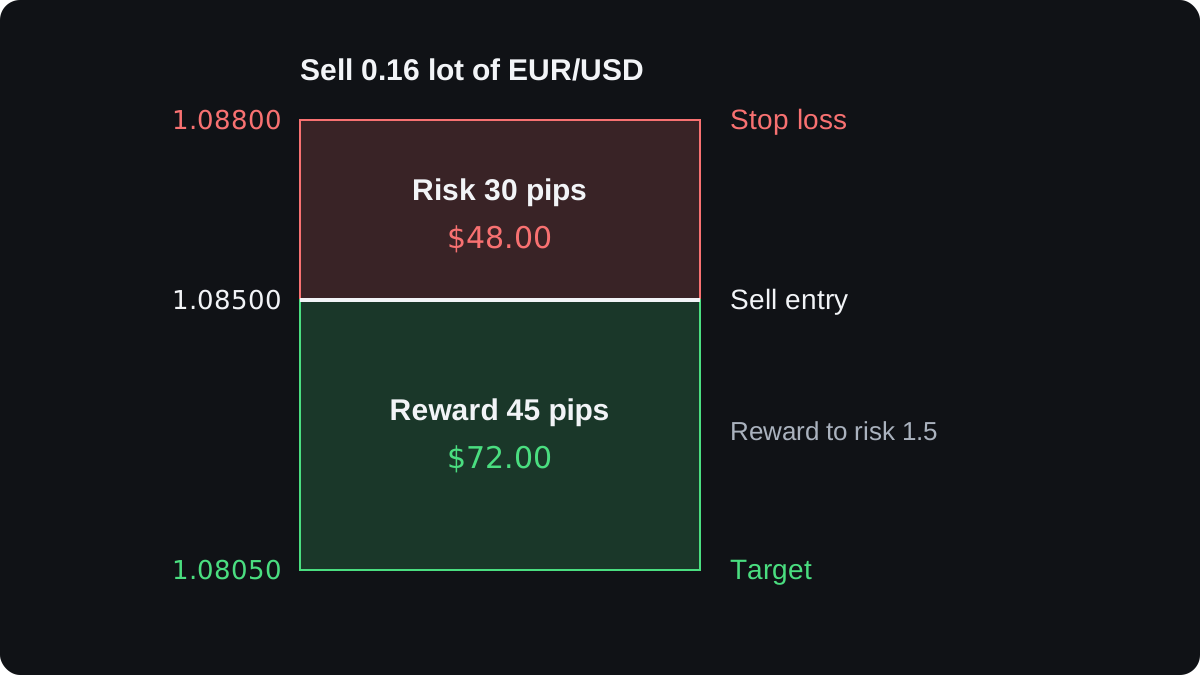
- Entry: the false break candle closes at 1.08500, so you sell at 1.08500.
- Stop: the candle's high was 1.08750. With 5 pips of room, the stop goes at 1.08800.
- Risk in pips: 1.08800 minus 1.08500 = 0.00300, which is 30 pips.
- Risk in money: 1% of $5,000 is $50, and $50 ÷ 30 pips = $1.67 per pip.
- Size: one standard lot of EUR/USD is worth $10 per pip, so $1.67 per pip needs about 0.167 lot. Rounding down to 0.16 lot gives $1.60 per pip and a risk of 30 × $1.60 = $48.00.
- Target: support is 1.08000, so you aim a little short at 1.08050. That is 1.08500 minus 1.08050 = 0.00450, or 45 pips.
- Reward: 45 × $1.60 = $72.00, which is 1.5 times the $48.00 at risk.
The spread changes when those orders fire. A short closes with a buy, so on most platforms its stop and target trigger on the ask price, which sits above the bid.
With a 1 pip spread, the stop fires when the bid chart shows 1.08790, a pip early, and the target when it shows 1.08040, a pip late. You still buy back at 1.08800 or 1.08050, so the $48.00 and $72.00 stay the same.
The lot size calculator repeats steps 4 and 5 for any pair, stop distance and account size.
Where the fakeout setup goes wrong
The plain failure is a break that was real all along. You sell the close back inside, and the next candle breaks out again and runs. The stop at 1.08800 is hit and the trade loses $48.00.
That $48.00 is a planned loss, and it can grow. If price jumps past the stop on news, the fill can be worse than 1.08800, which is slippage.
Ranges also end. Selling the top and buying the bottom of a range earns while the range lasts and loses once a trend begins.
You often only know which market you were in afterwards. The lesson on trending and ranging markets covers telling them apart.
One move can also fool both sides. Price can fake out above resistance, trap the sellers who sold the fake, and then break out for real. Backtesting your rules on past charts, then trying them on a demo, shows how they behave in both cases.
คำถามที่พบบ่อย
What is a fakeout in forex?
A fakeout is a move through a support or resistance level that quickly returns inside the old range. It is another name for a false breakout.
How do you avoid false breakouts?
You cannot avoid them all. Waiting for a candle close beyond the level, or for a retest that holds, filters out some of them at the cost of later entries.
Where do you put the stop on a false breakout trade?
Usually a few pips beyond the extreme of the failed break. In this lesson's example the high was 1.08750 and the stop went at 1.08800.
Are false breakouts more common than real ones?
There is no reliable figure. It depends on the market, the timeframe and how you define a break, so test your own rules on past data instead of trusting a headline number.
Is a false breakout the same as a stop hunt?
They can look identical on a chart. Stop hunt implies someone pushed price on purpose, which a chart cannot prove, while false breakout only describes what price did.
เรียนต่อ
 บทที่ 2What is a breakout?A breakout is a move that takes price out of a range or chart pattern, through a support or resistance level that had held it before. Traders usually wait for a candle to close beyond the level. A break tends to hold better when the move is strong and agrees with the larger trend, though neither condition guarantees it.
 บทที่ 2How to trade breakouts.You can trade a breakout in three ways. Enter on the break with a stop order, wait for a candle to close beyond the level, or wait for price to retest it. Earlier entries catch more moves and more false starts; later entries filter some failures but cost price or missed trades.

