The economic releases that move forex.
The economic releases that move forex most are jobs reports, inflation (CPI), GDP, retail sales and PMI surveys. They matter because they change what traders expect central banks to do with interest rates. A release mostly moves its own country's currency, and US data reaches furthest because the dollar is on one side of most trades.
เนื้อหานี้ยังมีเฉพาะภาษาอังกฤษ

At 8:30 in the morning New York time, one number from a US government office can move EUR/USD further in a minute than it moved all night.
Economic releases are scheduled reports on jobs, prices, output and spending, and forex prices often jump the moment they appear.
Why do economic numbers move exchange rates?
Exchange rates respond to interest rate expectations. If traders expect a central bank to keep rates higher for longer, deposits and bonds in that currency pay more, so demand for it tends to rise.
Central banks set rates by reading the economy. They watch inflation and jobs most closely, so each new report changes the odds of a rate move, and traders reprice the currency within seconds.
Say US inflation comes in above forecast. Traders expect the Federal Reserve to keep rates high for longer, US bond yields rise and the dollar tends to strengthen.
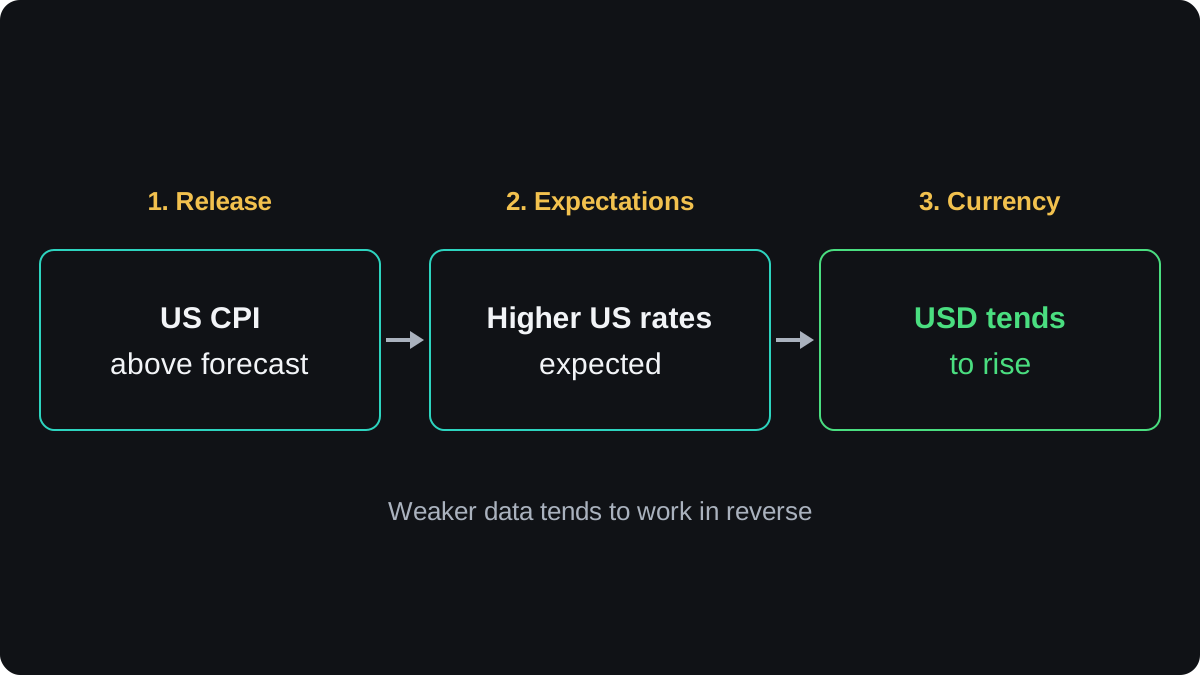
Prices already reflect the forecast before the release, so the move comes from the gap between forecast and actual. A high number that everyone expected can leave the price flat.
The next lesson, expectations versus actual, covers that gap in detail.
Jobs reports: payrolls, unemployment and wages
The US Employment Situation report is often the busiest release of the month. The Bureau of Labor Statistics publishes it at 8:30 a.m. New York time, usually on the first Friday of the month.
It carries three numbers that traders watch:
- Nonfarm payrolls is the monthly change in the number of jobs at businesses and government, leaving out farm workers and a few other groups. It comes from a survey of employers.
- The unemployment rate is the share of the labour force without a job and looking for one. It comes from a separate survey of households.
- Average hourly earnings is wage growth. Central banks watch it because rising pay can push up prices.
The report also revises payrolls for the two previous months. A strong headline with large downward revisions can leave the market unimpressed, so read both.
Other countries publish their own labour data. Canada's Labour Force Survey and Australia's monthly labour force figures are closely watched for their currencies, and the UK publishes employment and wage data every month.
Inflation: CPI and core CPI
The consumer price index (CPI) tracks the cost of a basket of goods and services that households buy. It is the main inflation release in most countries, and many major central banks aim for inflation of about 2%.
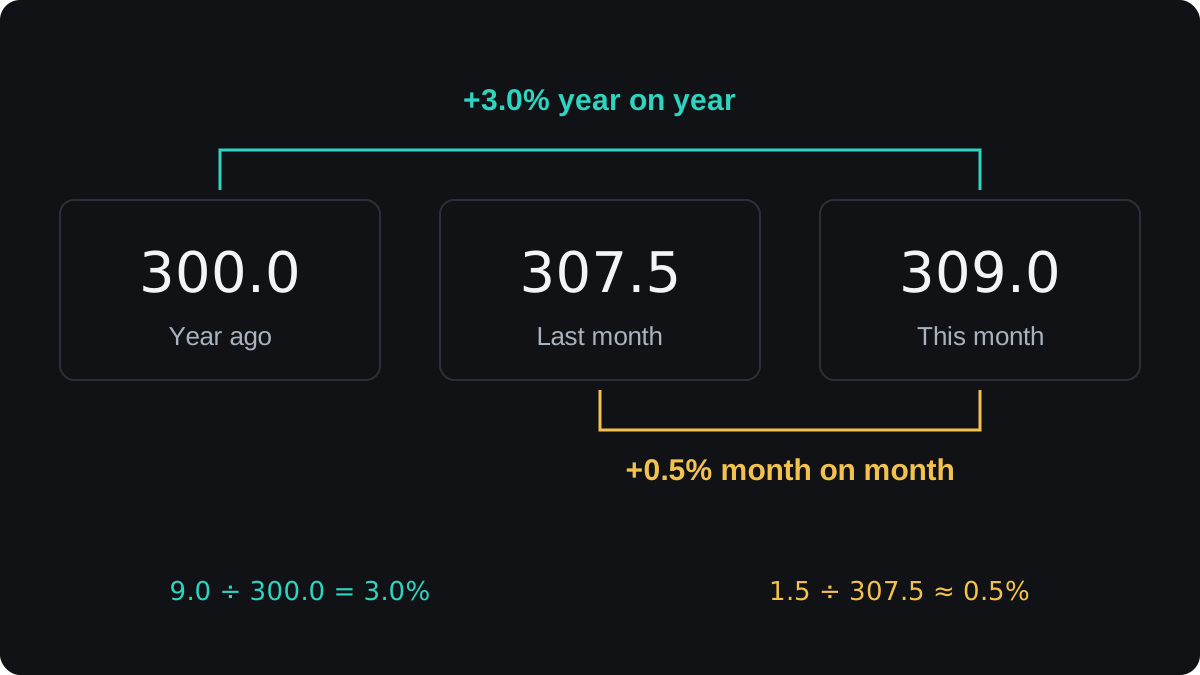
CPI is published as an index, and the headline is a percentage change. With round illustrative numbers:
- The index stood at 300.0 a year ago, 307.5 last month and 309.0 this month.
- Year on year: 309.0 − 300.0 = 9.0, and 9.0 ÷ 300.0 = 0.030, which is 3.0%.
- Month on month: 309.0 − 307.5 = 1.5, and 1.5 ÷ 307.5 = 0.0049, about 0.49%, published as 0.5%.
Core CPI removes the most volatile items, usually food and energy, though each country defines it slightly differently. Central banks watch core closely because it shows the underlying trend, while a jump in fuel prices can fade within months.
Inflation data tends to carry more weight when inflation sits far from target, since rate decisions then hinge on it. The inflation lesson explains that relationship.
GDP, retail sales and PMI surveys
Gross domestic product (GDP) is the total value of goods and services an economy produces. Most countries publish it quarterly, with a first estimate some weeks after the quarter ends and revised figures later.
GDP is broad but late. By the time it arrives, traders have already seen monthly data for most of the quarter, so it often moves prices less than its importance suggests.
Retail sales measure how much shops and online sellers took in during the month. Household spending is a large part of most economies, so this release gives an early read on demand.
A purchasing managers' index (PMI) is a survey. Companies say whether orders, output, hiring and similar measures rose, fell or held steady from the month before, and the answers become one number centred on 50.
A reading above 50 points to expansion compared with the previous month, and below 50 to contraction. So 52.0 signals growth and 48.0 a decline. Flash PMIs come out before the month ends, which makes them some of the earliest data available.
The US also has the ISM surveys of manufacturing and services, which use the same 50 line.
| Release | What it measures | How often | Why it moves currencies |
|---|---|---|---|
| Jobs report | Hiring, unemployment, wages | Monthly | Shapes the rate outlook |
| CPI | Consumer prices | Monthly in most countries | Direct input to rate decisions |
| GDP | Total output | Quarterly, some also monthly | Broad growth picture, but late |
| Retail sales | Shop and online sales | Monthly | Early read on consumer demand |
| PMI | Business conditions survey | Monthly | Earliest signal for the month |
Which currencies react to which releases?
A release mainly moves the currency of the country or area that publishes it, so US data moves every pair with USD in it. A pair can react to either side: EUR/USD moves on eurozone data and on US data.
US data often reaches further. The dollar is on one side of most forex trades and US yields affect rates worldwide, so a strong US jobs report can move USD/JPY and AUD/USD at the same time.
| Currency | Releases often watched closely |
|---|---|
| USD | Jobs report, CPI, retail sales, ISM PMIs, GDP |
| EUR | Eurozone flash inflation, PMIs, German Ifo survey |
| GBP | CPI, labour market data, monthly GDP, retail sales |
| JPY | Tokyo CPI, national CPI, wage data, plus US yields |
| AUD | Labour force data, CPI, Chinese data |
| CAD | Labour Force Survey, CPI, plus oil prices |
| NZD | Quarterly CPI and employment data, Chinese data |
| CHF | CPI, plus the general mood for risk |
Commodity currencies have an extra channel. China is a large buyer of Australian and New Zealand exports, so Chinese PMIs and trade figures can move AUD and NZD. The commodity currencies lesson covers this.
The ranking shifts over time. When a central bank is fighting inflation, CPI tends to move its currency most, and when it worries about a slowdown, jobs and growth data take the lead.
An economic calendar shows what is due and when. The calendar lesson explains how to read one.
What happens to prices and costs at release time?
Around a big release, liquidity thins. Price providers pull or widen their quotes for a few seconds, so spreads widen and the next available price can sit far from the last one.
That raises your costs. A spread of 1.0 pip in a quiet hour can be several pips wide at the release, and a stop loss can fill well past its level. This is called slippage.
Here is a short trade caught by a hot inflation number, with round illustrative prices and the spread left out to keep the sums simple:
- Before the release you sell 0.10 lot of USD/JPY at 150.00, with a stop loss at 150.30, 30 pips away.
- On USD/JPY a pip is 0.01. On 10,000 dollars, one pip is 10,000 × 0.01 = ¥100, so you planned to risk 30 × ¥100 = ¥3,000.
- CPI comes in above forecast and the price jumps from 150.00 to about 150.90 within one candle. Your broker quotes no price between 150.30 and 150.60.
- Your stop triggers and fills at the first available price, 150.60. The loss is 150.60 − 150.00 = 0.60, which is 60 pips.
- 60 × ¥100 = ¥6,000, double the planned risk. At 150.60 yen per dollar that is ¥6,000 ÷ 150.60 = $39.84.
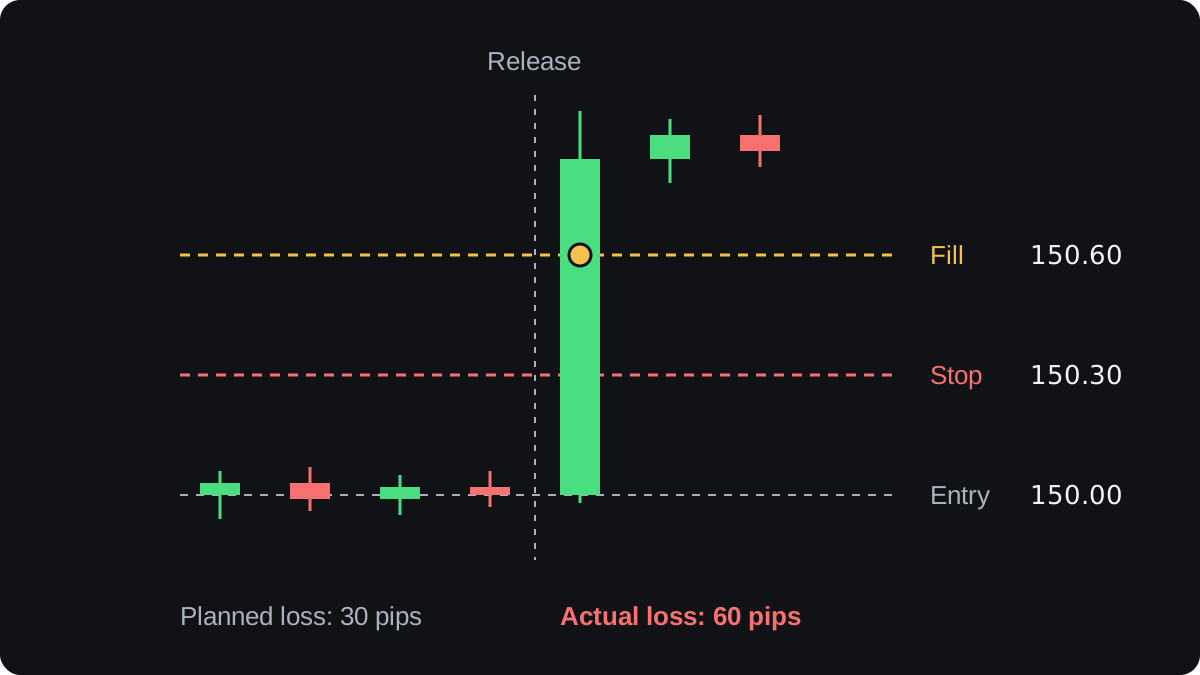
Release moves can also reverse within minutes, so the first jump is not always the final one.
Trading in the minutes around a release is a style with its own rules and risks, covered in the news reaction lesson.
คำถามที่พบบ่อย
Which economic release moves forex the most?
The US jobs report and US CPI are usually among the biggest, because they feed Federal Reserve rate expectations and the dollar is in most trades. Central bank rate decisions can move prices as much or more.
What time is nonfarm payrolls released?
At 8:30 a.m. New York time, usually on the first Friday of the month. Holidays and scheduling can shift the date, so check a calendar.
Why did a currency fall after good data?
The market may have expected an even better number, revisions may have cut earlier figures, or another part of the report, such as wages, may have disappointed. The price reacts to the whole surprise.
What does a PMI above 50 mean?
It points to expansion in business conditions compared with the previous month. A reading below 50 points to contraction.
Should beginners trade during big releases?
Wide spreads, slippage and fast reversals make release minutes harder to trade. If you hold a position into a release, size it on the assumption that your stop may fill far from its level.
เรียนต่อ
 บทที่ 2Expectations versus actual: why surprises move markets.Prices move on the gap between what the market expected and what was published. Before a release, the consensus forecast is largely reflected in the exchange rate. When the actual figure differs, that difference, called the surprise, drives the move. A strong number can still push a currency down if traders expected more.
 บทที่ 2How to read an economic calendar.An economic calendar lists scheduled data releases with their time, currency and importance rating. Compare the actual figure with the forecast, since prices tend to react to the surprise, and check whether the previous figure was revised. Confirm the calendar's time zone too, because daylight saving can move a US release by an hour on your clock.

