Expectations versus actual: why surprises move markets.
Prices move on the gap between what the market expected and what was published. Before a release, the consensus forecast is largely reflected in the exchange rate. When the actual figure differs, that difference, called the surprise, drives the move. A strong number can still push a currency down if traders expected more.
本頁目前僅提供英文版。

A country reports that its economy added 200,000 jobs last month. That sounds healthy, yet its currency drops within seconds. Traders had expected 250,000, so the healthy number was a disappointment.
Markets trade on what they expect before a figure is published. When the figure arrives, price moves on the gap between the forecast and the actual result. That gap is called the surprise.
What is the forecast, and why is it already in the price?
The previous lesson covered which releases tend to move forex. Before each one, news and data firms ask economists what they expect and publish the middle answer. This is the consensus forecast.
An economic calendar lists the forecast next to the previous result. Once the figure is out, the actual number appears beside them.
Traders act on the forecast in the days before. If a strong report is expected, some buy the currency early, and the price climbs before anything is announced.
By release time, the expected result is largely reflected in the exchange rate. Traders say it is priced in. Only the part nobody expected is new information, so only that part gives the price a reason to move.
Forecasts can differ slightly between calendars, because each may draw on its own survey. Compare a result with one source's forecast when you judge the surprise.
How do you measure a surprise?
The sum is a subtraction:
Surprise = actual − forecast
Take an inflation report showing prices 3.2% higher than a year earlier. Whether that counts as hot or cool depends on the forecast. These numbers are illustrative.
Against a forecast of 3.0%, the surprise is 3.2 − 3.0 = +0.2 point, higher than expected. Against a forecast of 3.2% it is 0.0, in line. Against 3.4% it is 3.2 − 3.4 = −0.2 point, lower than expected.
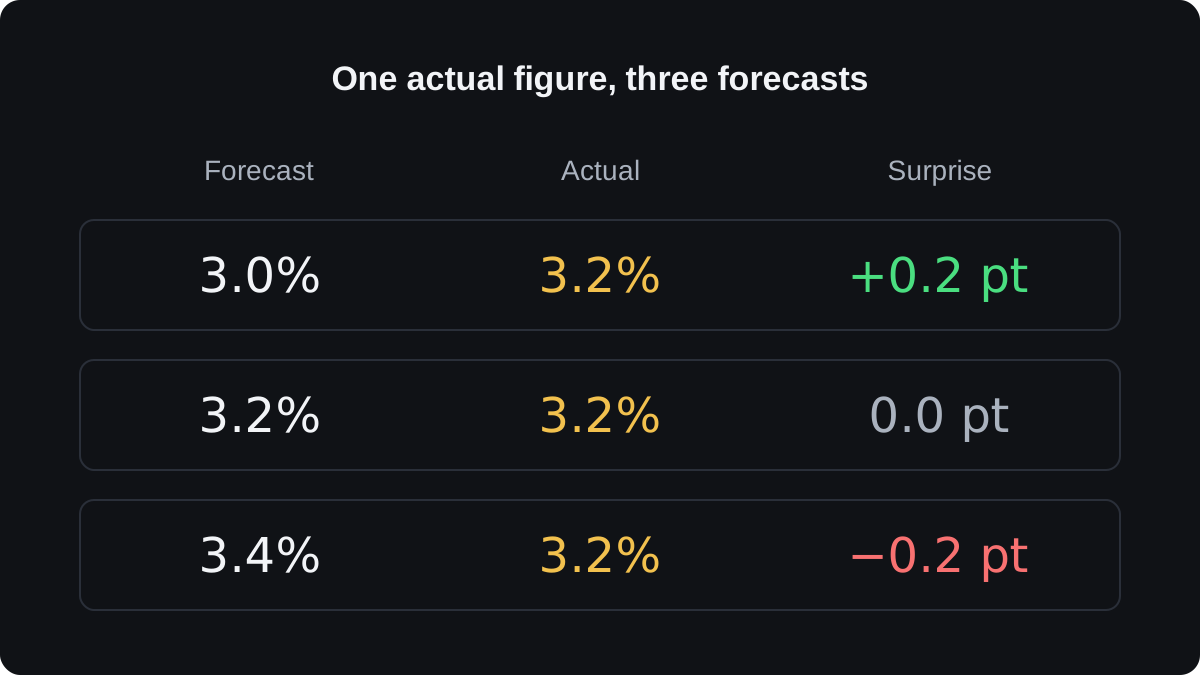
Inflation is already a percentage, so the gap is measured in percentage points (pt). Going from 3.0% to 3.2% is 0.2 point, while in relative terms 3.2 is about 6.7% larger than 3.0.
The size of a surprise only means something next to the usual miss. Suppose an inflation figure normally lands within 0.1 point of its forecast. A 0.2 point miss is then twice the normal size.
A jobs figure counted in hundreds of thousands behaves differently. If it often misses its forecast by 50,000, a 20,000 miss is ordinary. Judge each surprise against that release's own history.
Which way does a surprise push a currency?
The usual chain runs through interest rates. Growth or inflation data stronger than expected makes markets think the central bank may keep rates higher for longer, and the currency tends to rise.
Weaker data tends to do the reverse. The lesson on interest rates and currencies explains why rate expectations carry so much weight.
Tends is the right word here. A hot inflation figure can also raise fears for growth, and on some days that worry drives the price instead.
On a pair, direction depends on which currency the data belongs to. US data concerns the US dollar, the quote currency in EUR/USD, so a dollar-positive surprise usually shows up as EUR/USD falling.
Here is an illustrative case. EUR/USD sits at 1.08500 before a US inflation release. The forecast is 3.0% and the actual is 3.2%, a surprise of +0.2 point.
- In the first minute, EUR/USD drops to a low of 1.08150.
- That move is 1.08500 − 1.08150 = 0.00350, or 35 pips.
- Over the next four minutes it recovers to 1.08300, a rebound of 1.08300 − 1.08150 = 0.00150, or 15 pips.
- Five minutes after the release, the pair is 1.08500 − 1.08300 = 0.00200, or 20 pips, below where it started.
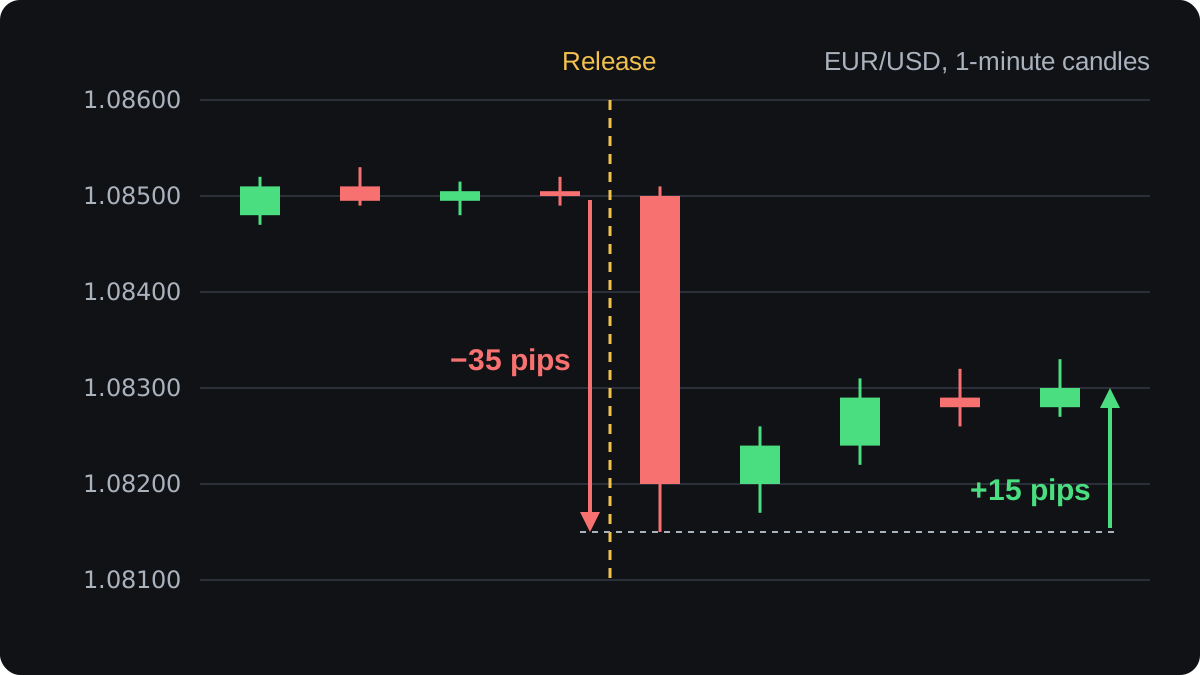
The first move is often the fastest, and part of it can reverse as traders read the rest of the report.
Why does the reaction sometimes go the wrong way?
A currency that rises on bad news, or falls on good news, usually reflects something the headline number left out.
The previous figure gets revised
Many reports update earlier months as more complete data comes in. Such a revision changes what the market thought it already knew.
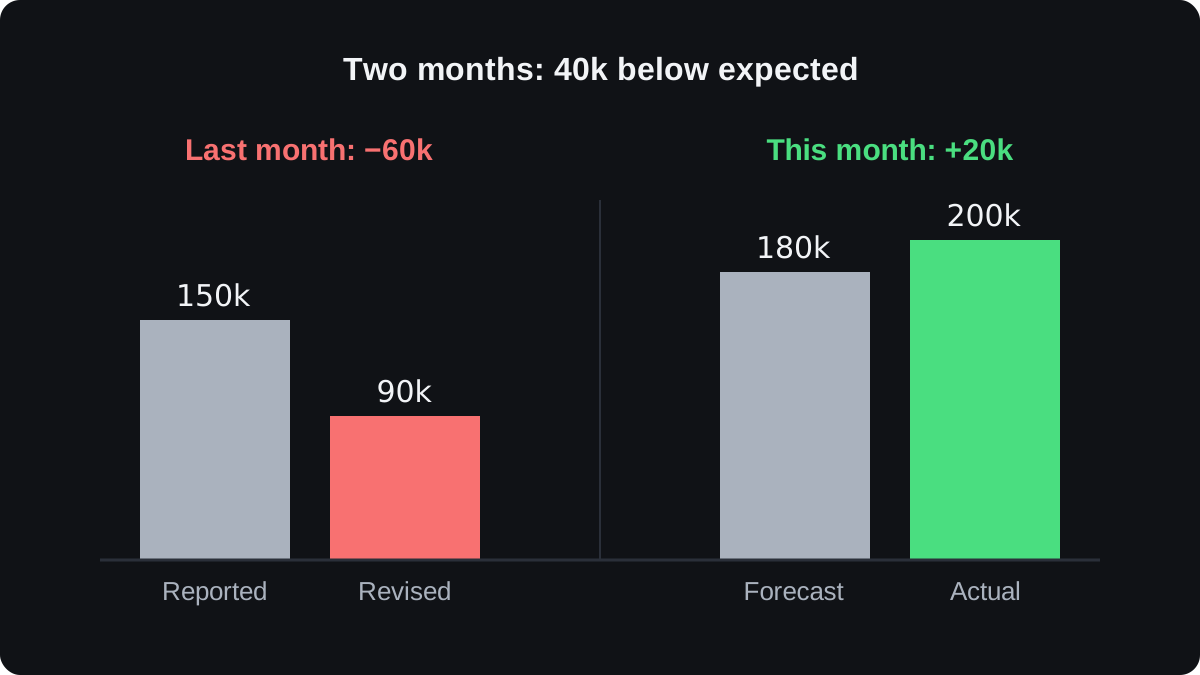
Say last month's jobs figure was first reported as 150,000. This month the forecast is 180,000 and the actual is 200,000, a beat of 20,000. The same report cuts last month to 90,000, a revision of −60,000.
Add the two months together:
- Expected total before the release: 150,000 + 180,000 = 330,000.
- Total as now reported: 90,000 + 200,000 = 290,000.
- Difference: 290,000 − 330,000 = −40,000.
The headline beat its forecast, yet the two months together came in 40,000 below what the market had counted on. A currency can fall on that report.
The details disagree with the headline
Inflation reports usually include a core measure that leaves out volatile items such as food and energy. If the headline beats but core misses, the market may follow core, because central banks often pay close attention to it.
A jobs report may also include wage growth and the unemployment rate. When these point in different directions, the first price move can flip once traders have read them.
The bigger picture outweighs one number
If a central bank has already signalled its next move clearly, one release may barely change rate expectations. A small surprise then brings a small move, or none.
How traders are positioned counts as well. If many bought ahead of an expected beat, a result that only matches the forecast can lead them to sell and take profit, pushing the currency down.
What does trading around a release cost?
Prices move fast in the first seconds after a big figure, and dealing costs often rise at the same moment.
The spread often widens around major releases. Suppose it is 1.0 pip normally and 5.0 pips at the moment of the release, as illustrative numbers.
On 0.10 lot of EUR/USD a pip is worth $1. The wider spread therefore costs you $5.00 on entry instead of $1.00.
Slippage is the gap between the price you asked for and the price you got. Say you hold 0.10 lot long with a stop loss at 1.08300, and the drop in the example above runs straight through it.
If the stop fills at 1.08260, you lose 1.08300 − 1.08260 = 0.00040, or 4 pips, more than planned. At $1 per pip that is an extra $4.00.
A surprise is easy to explain after the move. Trading it live means judging both the number and the market's reaction within seconds, and no rule reliably predicts the size or direction of that reaction.
The next lesson on reading an economic calendar shows where to find the forecast, the previous figure and the expected impact before each release.
常見問題
What does priced in mean in forex?
It means the exchange rate has already adjusted to an expected result. When the actual figure matches the forecast, there is little new information, so the price often moves little.
Where does the forecast on an economic calendar come from?
Usually from a survey of economists collected by a news or data firm, reported as the middle answer. Calendars may use different surveys, so their forecasts can differ slightly.
Why did a currency fall after better than expected data?
Common reasons are a downward revision to earlier months, weak details such as core inflation or wages, or traders taking profit after buying ahead of the release.
How do I calculate a data surprise?
Subtract the forecast from the actual figure. An actual of 3.2% against a forecast of 3.0% is a surprise of +0.2 percentage point.
Should beginners trade during economic releases?
Costs are usually higher at release time because spreads widen and slippage is more likely, and early moves can reverse quickly. Watching releases on a demo account lets you study the reaction without risking money.
繼續學習
 第 2 章The economic releases that move forex.The economic releases that move forex most are jobs reports, inflation (CPI), GDP, retail sales and PMI surveys. They matter because they change what traders expect central banks to do with interest rates. A release mostly moves its own country's currency, and US data reaches furthest because the dollar is on one side of most trades.
 第 2 章How to read an economic calendar.An economic calendar lists scheduled data releases with their time, currency and importance rating. Compare the actual figure with the forecast, since prices tend to react to the surprise, and check whether the previous figure was revised. Confirm the calendar's time zone too, because daylight saving can move a US release by an hour on your clock.

