Chart indicators cheat sheet.
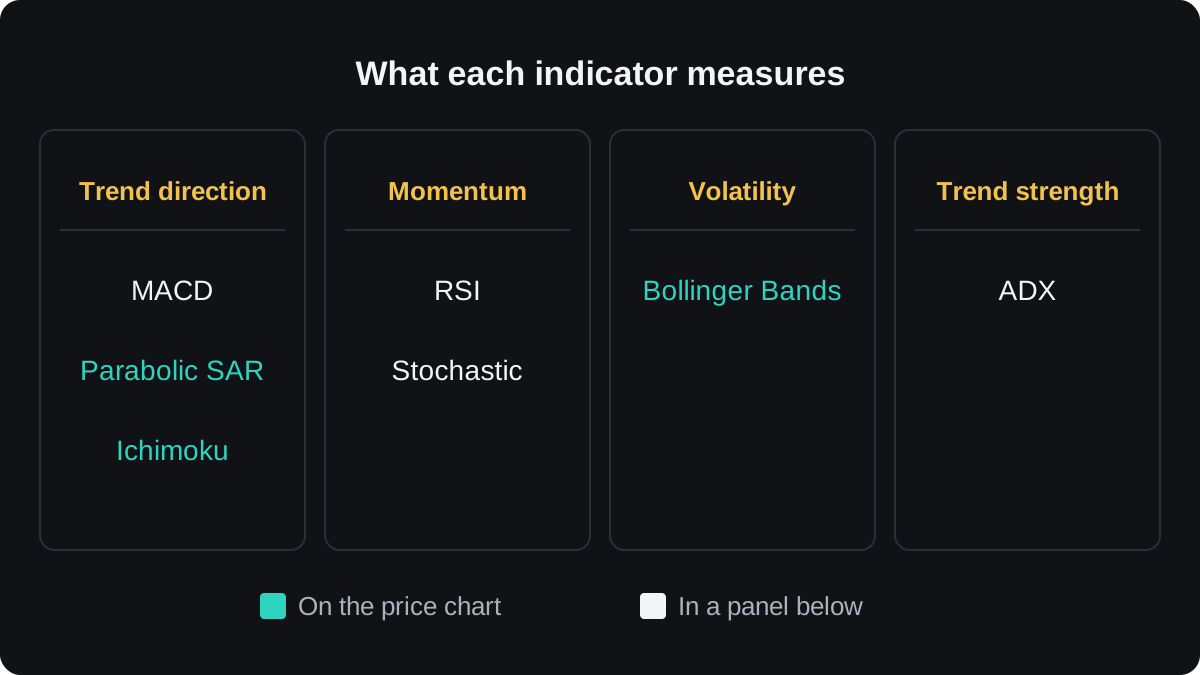
A chart indicator turns past prices into a number or line. Bollinger Bands measure volatility. MACD, Parabolic SAR and Ichimoku follow trend direction. RSI and the stochastic measure momentum, and ADX measures trend strength. Each has a common signal, and each fails in a predictable kind of market, usually trends for oscillators and ranges for trend tools.
이 내용은 현재 영어로만 제공됩니다.

Every indicator in this module is built from past prices, usually the open, high, low and close of each bar. This sheet puts all seven side by side.
The settings below are common textbook defaults. Platforms differ, so check yours before you compare readings with someone else's chart.
Which indicator measures what?
Each indicator answers one narrow question about price, so start with the question. Bollinger Bands, Parabolic SAR and Ichimoku are drawn on the price chart. The other four sit in a panel below, on their own scale.
| Indicator | Measures | Defaults | Common signal | Weak spot |
|---|---|---|---|---|
| Bollinger Bands | Volatility | 20 SMA, 2 standard deviations | Squeeze, then breakout | Price hugs one band in strong trends |
| MACD | Trend and momentum | 12, 26, 9 | MACD crosses signal line | Lags, flat markets |
| Parabolic SAR | Trend and trailing stop | Step 0.02, max 0.20 | Dots flip sides | Ranges |
| Stochastic | Close within recent range | %K 14, %D 3 | Cross back from above 80 or below 20 | Strong trends |
| RSI | Gains against losses | 14 | Above 70, below 30, divergence | Strong trends |
| ADX | Trend strength only | 14 | Above 25 trending, below 20 weak | Slow, no direction |
| Ichimoku | Trend and support | 9, 26, 52 | Price above or below cloud | Busy, mostly lagging |
Trend tools: MACD, Parabolic SAR and Ichimoku
MACD is the 12-period exponential moving average (EMA) minus the 26-period EMA. Its signal line is a 9-period EMA of that result, and the histogram is the gap between the two lines.
Parabolic SAR puts a dot below price in an uptrend and above it in a downtrend. The dot creeps closer each bar, so it can double as a trailing stop.
Ichimoku draws five lines. Its cloud is plotted 26 periods ahead: price above it reads as an uptrend, below it as a downtrend.
All three confirm a move after it starts. In a sideways market they give a string of small wrong signals, called whipsaws.
Oscillators: RSI and the stochastic
RSI compares average gains with average losses over 14 periods. The stochastic shows where the latest close sits in the high-low range of the last 14 bars. Both run from 0 to 100.
ADX uses the same scale, with thresholds that mark trend strength in either direction.
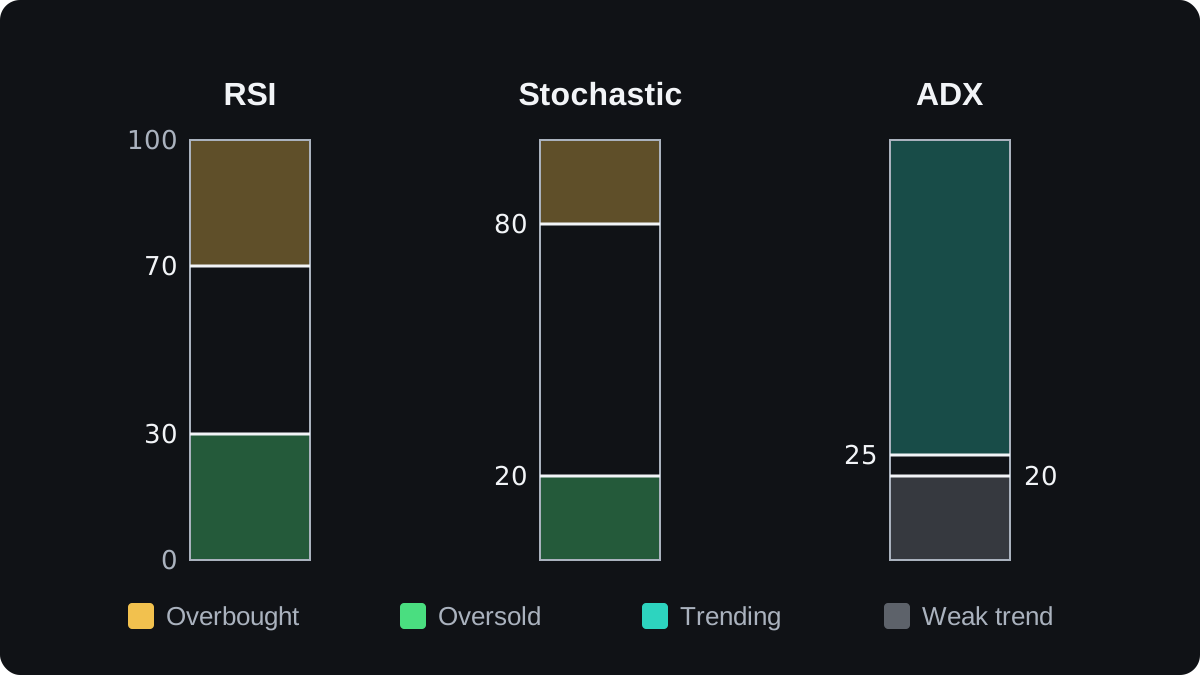
Overbought only means price rose fast over the lookback period. In a strong uptrend RSI can stay above 70 while price keeps climbing.
Divergence, where price makes a higher high while RSI makes a lower high, warns that momentum is fading, sometimes long before price turns.
Volatility and strength: Bollinger Bands and ADX
Bollinger Bands sit two standard deviations above and below a 20-period simple moving average. A tight squeeze shows low volatility but no direction, so traders usually wait for a close outside a band.
ADX rises when price moves strongly either way, so a falling market can show a high ADX. Its +DI and -DI lines supply the direction: +DI above -DI points up.
Worked example: five readings on one chart
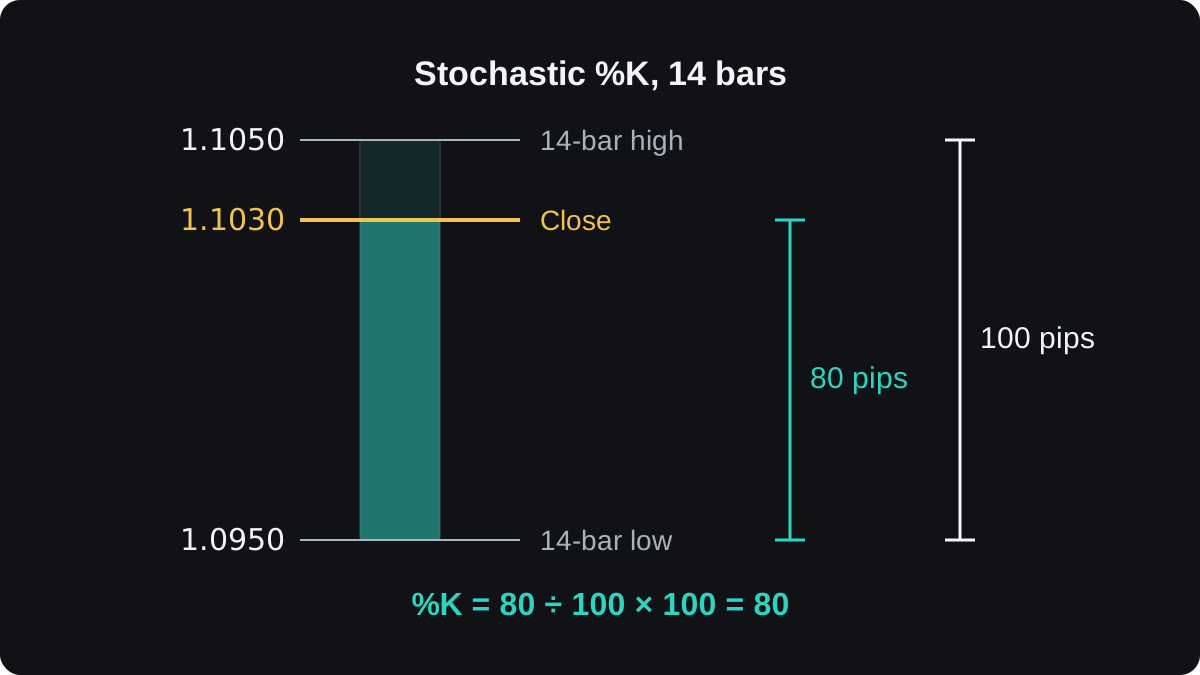
Take an illustrative daily EUR/USD chart. Over 14 bars the high is 1.1050, the low is 1.0950 and the latest close is 1.1030.
- Range = 1.1050 − 1.0950 = 0.0100, or 100 pips.
- Close above the low = 1.1030 − 1.0950 = 0.0080, or 80 pips.
- Stochastic %K = 80 ÷ 100 × 100 = 80.
Now suppose the 14-period average gain is 14 pips and the average loss is 6 pips.
- RS = 14 ÷ 6, so RSI = 100 − 100 ÷ (20/6) = 100 − 30 = 70.
For Bollinger Bands, take a 20-period average of 1.1000 and a standard deviation of 0.0020.
- Upper band = 1.1000 + 2 × 0.0020 = 1.1040, and the lower band is 1.0960. The close is 10 pips under the upper band.
For MACD, take a 12-period EMA of 1.1022, a 26-period EMA of 1.1010 and a signal line at 0.0015.
- MACD = 1.1022 − 1.1010 = 0.0012, and the histogram is 0.0012 − 0.0015 = −0.0003.
ADX reads 18, under the usual weak-trend level of 20.
Together, both oscillators sit at their upper thresholds, price is near the upper band, MACD is positive but slowing, and no strong trend shows. That fits price near the top of a range, and it is no forecast.
Mistakes that come from using a cheat sheet
RSI and the stochastic measure momentum from the same bars, so their agreement above adds little. The lesson on combining indicators pairs tools from different groups.
Reading overbought as sell and oversold as buy fails in strong trends. Tuning settings until an old chart looks perfect is called curve fitting, and it often does worse on new data.
Published tests of default signals give mixed results that depend on the market, the period and the costs counted.
Every tool here reacts to price after the fact. The leading and lagging indicators lesson explains what that delay means for entries.
자주 묻는 질문
Which chart indicator is best for beginners?
None is best in general. Pick by question: ADX for whether a trend exists, MACD for its direction, RSI for whether a move looks stretched.
What is the difference between RSI and the stochastic?
RSI compares average gains with average losses. The stochastic compares the latest close with the recent high-low range, and it usually swings more sharply.
Does overbought mean the price will fall?
No. It means price rose quickly over the lookback period, and in a strong trend it can stay overbought for a long time.
Should I change the default settings?
Shorter settings react faster with more false signals, and longer ones are smoother and later. Test changes on past data and a demo account.
Which indicator shows trend strength?
ADX. Readings above about 25 are commonly read as trending, and below 20 as a weak trend or none.
이어서 배우기
 챕터 5Bollinger Bands.Bollinger Bands are three lines on a price chart: usually a 20-period simple moving average in the middle, with bands two standard deviations above and below it. The bands widen when price moves a lot and narrow when it is quiet. A narrow stretch, called a squeeze, often comes before a larger move in either direction.
 챕터 5MACD indicator.MACD, short for moving average convergence divergence, measures the gap between a 12-period and a 26-period exponential moving average of price. A 9-period EMA of that gap forms the signal line, and the histogram shows the difference between the two. It is read as momentum, but it lags price and gives many false signals in ranges.
 챕터 5Parabolic SAR.Parabolic SAR is a trend indicator that draws a dot for each bar, below price in an uptrend and above it in a downtrend. The dots move closer to price as the trend extends, and when price crosses them they flip sides. It is often used as a trailing stop, and it gives many false flips in sideways markets.
 챕터 5Stochastic oscillator.The stochastic oscillator shows where the latest close sits within the high to low range of a set number of candles, on a scale of 0 to 100. Readings above 80 are called overbought and below 20 oversold. They describe recent closes near the top or bottom of the range and do not mean price must reverse.
 챕터 5Relative Strength Index (RSI).The Relative Strength Index (RSI) is a momentum indicator that compares the size of recent gains with recent losses and plots the result from 0 to 100. The default uses 14 candles. Readings above 70 are called overbought and below 30 oversold, but in a strong trend RSI can stay beyond those lines for a long time.
 챕터 5Average Directional Index (ADX).The Average Directional Index (ADX) measures how strong a trend is on a scale of 0 to 100, without saying which way it points. Readings above about 25 are commonly read as a trending market and below about 20 as a weak or ranging one. Two companion lines, +DI and −DI, show direction.
 챕터 5Ichimoku Kinko Hyo.Ichimoku Kinko Hyo is a Japanese trend indicator with five lines: a 9-period conversion line, a 26-period base line, two leading spans that form a cloud 26 periods ahead, and the close plotted 26 periods back. Price above the cloud is read as an uptrend bias, below it as a downtrend bias.
 챕터 5How to combine indicators.Combine indicators by giving each one a different job. Use one tool to read the trend's direction or strength, and another to time entries, such as a moving average with RSI. Avoid stacking tools that measure the same thing, like RSI and Stochastic together, because they repeat one signal and only look like confirmation.

