Parabolic SAR.
Parabolic SAR is a trend indicator that draws a dot for each bar, below price in an uptrend and above it in a downtrend. The dots move closer to price as the trend extends, and when price crosses them they flip sides. It is often used as a trailing stop, and it gives many false flips in sideways markets.
이 내용은 현재 영어로만 제공됩니다.
Add Parabolic SAR to a chart and a trail of dots appears, one per bar. In a rising market they sit under the candles and creep upward. When the market turns, they jump to the other side of price.
SAR stands for stop and reverse. J. Welles Wilder Jr. published it in his 1978 book New Concepts in Technical Trading Systems, which also introduced RSI and the ADX.
What do the dots on the chart tell you?
Each dot is a price level. A dot below the bar means the indicator reads the trend as up. A dot above the bar means it reads the trend as down.
The dot is also a stop level. Wilder built it as a system that is always in the market: when price reaches the dot, you close the trade and open one in the opposite direction.
The dots are drawn on the price chart itself, with no separate panel or scale. To read the indicator, you check which side of price the dots are on and how far away they sit.
How is Parabolic SAR calculated?
Each dot is worked out from the one before it:
Next SAR = SAR + AF × (EP minus SAR)
The extreme point (EP) is the highest high of the current uptrend, or the lowest low of the current downtrend. The acceleration factor (AF) sets how much of the gap between the dot and the EP is closed on each bar.
The AF starts at 0.02. Each time the trend makes a new extreme, it rises by another 0.02, up to a maximum of 0.20. Getting from 0.02 to 0.20 takes nine new extremes.
A guard rule keeps the dot clear of recent prices. In an uptrend, the next SAR may not sit above the lows of the last two bars.
If the formula puts it there, the dot is moved down to the lower of those two lows. A downtrend uses the last two highs in the same way.
The values 0.02 and 0.20 are Wilder's originals, and MetaTrader shows them as Step 0.02 and Maximum 0.2. Other platforms may use other names, so check the indicator's settings window.
Worked example: an uptrend on EUR/USD
The prices below are round and illustrative. On EUR/USD a pip is 0.0001, so each gap is easier to read in pips: 1.08500 minus 1.08000 is 0.00500, or 50 pips.
A new uptrend starts on bar 1 with the SAR at 1.08000, and the example counts no bars before it.
Bar 1's high of 1.08500 is the first EP, and the AF is 0.02. Bars 2, 3 and 4 each make a new high, and bar 5 does not.
| Bar | SAR | EP | AF | Gap (pips) | Step (pips) | Next SAR |
|---|---|---|---|---|---|---|
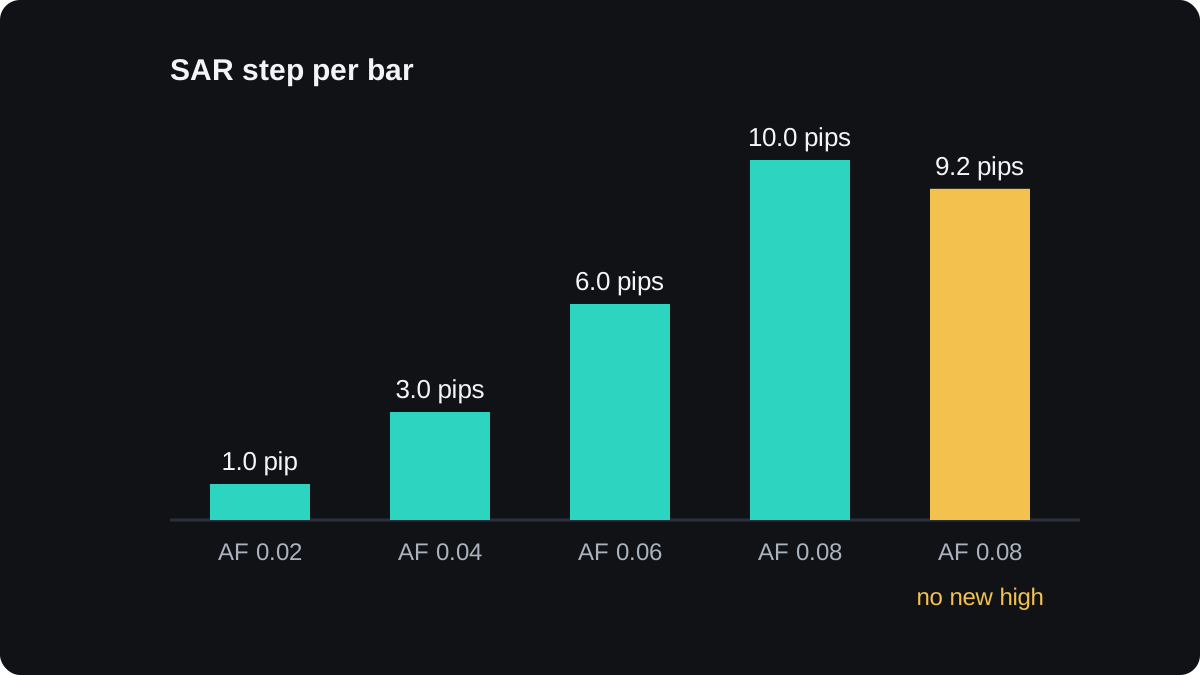
| 1 | 1.08000 | 1.08500 | 0.02 | 50 | 1.0 | 1.08010 |
| 2 | 1.08010 | 1.08760 | 0.04 | 75 | 3.0 | 1.08040 |
| 3 | 1.08040 | 1.09040 | 0.06 | 100 | 6.0 | 1.08100 |
| 4 | 1.08100 | 1.09350 | 0.08 | 125 | 10.0 | 1.08200 |
| 5 | 1.08200 | 1.09350 | 0.08 | 115 | 9.2 | 1.08292 |
Take bar 2 as a check. Its high of 1.08760 is a new extreme, so the EP moves there and the AF rises to 0.04.
The gap is 1.08760 minus 1.08010, which is 75 pips. Then 0.04 × 75 = 3 pips, so the next SAR is 1.08010 + 0.00030 = 1.08040.
Bar 5 reached only 1.09300, below the EP of 1.09350. The EP and the AF stay where they were, and the step is 0.08 × 115 = 9.2 pips, which gives 1.08292.
The lows of bars 1 to 5 were 1.08200, 1.08400, 1.08700, 1.08950 and 1.09000. Each next SAR sits below the lows it is checked against, so the guard rule never had to step in.
The step grew from 1 pip to 10 pips in four bars. While new highs keep coming, the AF and the gap both grow, so the dots curve up toward price faster each bar. That curving path is why the indicator is called parabolic.
What happens when the dots flip?
Bar 6 opens at 1.09050 and falls to a low of 1.08250. That low is below the SAR of 1.08292, so the uptrend reading ends on this bar.
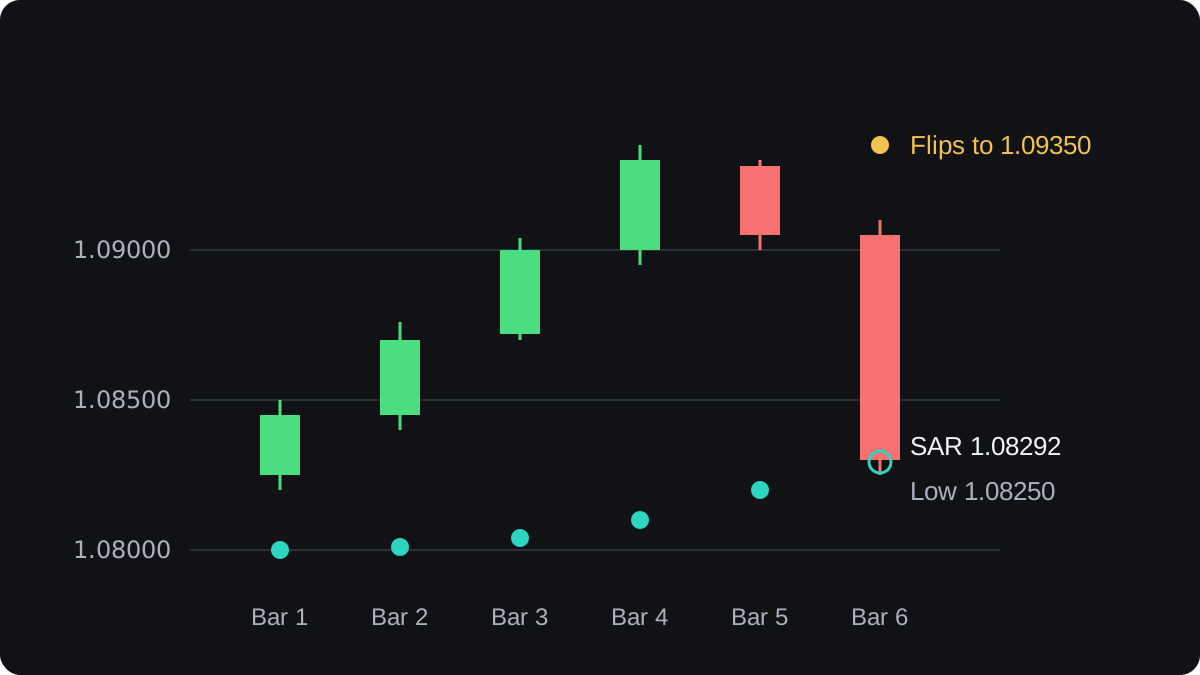
The flip changes all three inputs at once:
- The SAR jumps to the old extreme point, 1.09350, and now sits above price.
- The EP becomes the lowest low of the new downtrend, so far bar 6's low of 1.08250.
- The AF resets to 0.02.
The next dot uses the same formula, now pointing down: 1.09350 + 0.02 × (1.08250 minus 1.09350) = 1.09350 minus 0.00022 = 1.09328.
That dot sits above the highs of bars 5 and 6, which were 1.09300 and 1.09100, so the guard rule leaves it alone.
Wilder's rule flips the moment a bar's low reaches the dot in an uptrend, or its high in a downtrend. Platforms do not all handle the bar still forming in the same way, so treat a flip as settled once that bar has closed.
Using the dots as a trailing stop
One way to use the indicator is as a trailing stop: after each bar closes, you move your stop loss to the new dot. The indicator only draws the level, so you or an automated tool has to move the order.
Say you bought 0.10 lot of EUR/USD at 1.09000, the open of bar 4. In a US dollar account, one pip on 0.10 lot is worth $1.
Your first stop is bar 4's dot at 1.08100. That is 90 pips below your entry, so the trade starts with $90 at risk.
After bar 4 you move the stop to 1.08200, and after bar 5 to 1.08292. Bar 6 falls through it:
- Exit price: 1.08292.
- Move against you: 1.09000 minus 1.08292 = 0.00708, which is 70.8 pips.
- Loss: 70.8 × $1 = $70.80, before spread and any commission.
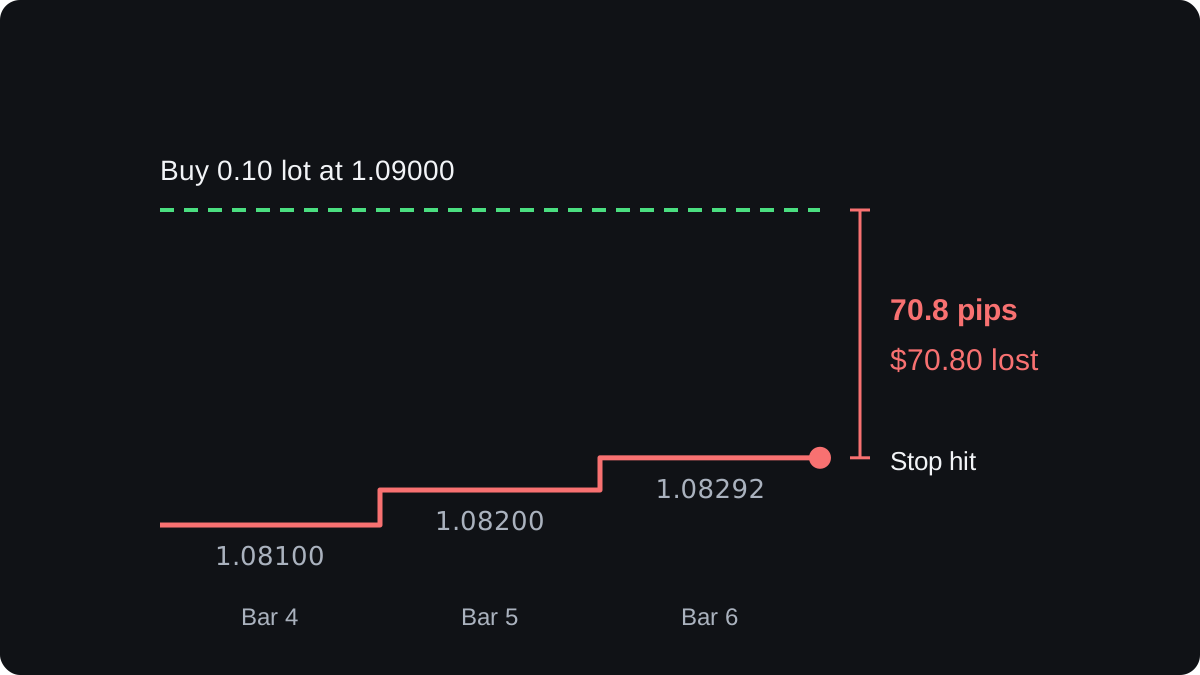
The example shows a weakness of trailing with SAR. The dots start far from price and catch up only as the trend matures, so a trade opened partway into a move carries a wide stop.
A stop order can also fill worse than the dot when price gaps or moves fast, as the slippage lesson explains. For pip values on other pairs, use the pip value calculator.
Where Parabolic SAR breaks down
The formula assumes there is always a trend to follow. In a sideways market price keeps reaching the dots, and each touch is a flip.
A trader who reverses on every flip in a range tends to take a run of losses and pays the spread on each new trade.
The settings trade speed against noise. A bigger step or maximum pulls the dots closer to price, so they flip sooner on real turns and on random swings alike. A smaller one keeps you in a trend longer but gives back more before the flip.
Every flip also comes late. The dot is built from past highs and lows, so price has to travel from the extreme back to the dot before the indicator reacts.
You can cut some false flips by checking first whether the market is trending, using ADX or the methods in trending versus ranging markets. Those filters lag too, so they remove some false flips and delay some real ones.
The combining indicators lesson covers how to pair tools without counting the same signal twice.
Wilder offered SAR as a complete trading system, yet a rule that looked good on past charts is no proof it will keep working. If you plan to rely on it, backtest it on your own pair and timeframe with costs included.
자주 묻는 질문
What do the settings 0.02 and 0.2 mean in Parabolic SAR?
0.02 is the step: the starting acceleration factor and the amount it rises with each new extreme. 0.2 is the maximum the factor can reach.
Is Parabolic SAR a leading or lagging indicator?
It is lagging. Each dot comes from past highs and lows, so a flip appears only after price has already moved back from the extreme to the dot.
Why did the dots jump to the other side of price?
Price reached the dot, which ends the current trend reading. The SAR resets to the extreme point of the old trend and the acceleration factor goes back to 0.02.
Does Parabolic SAR work on every timeframe?
The calculation is the same on any timeframe. On short timeframes the bars are smaller, so flips come more often and the spread takes a bigger share of each move.
Can you use Parabolic SAR in a sideways market?
You can, but it flips often there because price keeps crossing the dots. Checking for a trend first, for example with ADX, reduces those false flips without removing them.
이어서 배우기
 챕터 5Bollinger Bands.Bollinger Bands are three lines on a price chart: usually a 20-period simple moving average in the middle, with bands two standard deviations above and below it. The bands widen when price moves a lot and narrow when it is quiet. A narrow stretch, called a squeeze, often comes before a larger move in either direction.
 챕터 5MACD indicator.MACD, short for moving average convergence divergence, measures the gap between a 12-period and a 26-period exponential moving average of price. A 9-period EMA of that gap forms the signal line, and the histogram shows the difference between the two. It is read as momentum, but it lags price and gives many false signals in ranges.
 챕터 5Stochastic oscillator.The stochastic oscillator shows where the latest close sits within the high to low range of a set number of candles, on a scale of 0 to 100. Readings above 80 are called overbought and below 20 oversold. They describe recent closes near the top or bottom of the range and do not mean price must reverse.
 챕터 5Relative Strength Index (RSI).The Relative Strength Index (RSI) is a momentum indicator that compares the size of recent gains with recent losses and plots the result from 0 to 100. The default uses 14 candles. Readings above 70 are called overbought and below 30 oversold, but in a strong trend RSI can stay beyond those lines for a long time.
 챕터 5Average Directional Index (ADX).The Average Directional Index (ADX) measures how strong a trend is on a scale of 0 to 100, without saying which way it points. Readings above about 25 are commonly read as a trending market and below about 20 as a weak or ranging one. Two companion lines, +DI and −DI, show direction.
 챕터 5Ichimoku Kinko Hyo.Ichimoku Kinko Hyo is a Japanese trend indicator with five lines: a 9-period conversion line, a 26-period base line, two leading spans that form a cloud 26 periods ahead, and the close plotted 26 periods back. Price above the cloud is read as an uptrend bias, below it as a downtrend bias.
 챕터 5How to combine indicators.Combine indicators by giving each one a different job. Use one tool to read the trend's direction or strength, and another to time entries, such as a moving average with RSI. Avoid stacking tools that measure the same thing, like RSI and Stochastic together, because they repeat one signal and only look like confirmation.
 챕터 5Chart indicators cheat sheet.A chart indicator turns past prices into a number or line. Bollinger Bands measure volatility. MACD, Parabolic SAR and Ichimoku follow trend direction. RSI and the stochastic measure momentum, and ADX measures trend strength. Each has a common signal, and each fails in a predictable kind of market, usually trends for oscillators and ranges for trend tools.

