Combining fundamentals with technical analysis.
Combining the two means using fundamental analysis to decide which direction you favour for a currency pair, then using the chart to choose when to enter, where to place the stop and where to take profit. You act only on chart signals that agree with that direction, which cuts trades but does not guarantee better results.
เนื้อหานี้ยังมีเฉพาะภาษาอังกฤษ

Fundamental analysis can tell you that a currency has reasons to rise over the next few months. It cannot tell you whether to buy today at this price or wait for a better one.
Charts have the opposite gap. They show levels and trends, yet they say nothing about why a currency should move. A common way to use both is to let fundamentals choose the direction and let the chart choose the timing.
What does each kind of analysis do best?
Suppose your fundamental view says the euro should gain on the dollar, because you expect euro area interest rates to stay higher for longer. That view may take weeks or months to play out, and it gives you no entry price.
A chart gives exact numbers. A support level at 1.0800 or a recent high at 1.0940 is something you can place an order against. What a chart cannot show is whether a trend has a reason behind it.
So each method fills the other's gap. The fundamental view becomes your bias: the direction you favour, and therefore the side of the market you look for trades on. The chart supplies the entry, the stop loss and the target.
How do you turn a fundamental view into a bias?
Start from the work in the previous lesson: a currency you expect to strengthen, paired with one you expect to weaken. If the strong currency is the base currency, your bias is bullish and you look only for buys.
If the strong currency is the quote currency, the bias is bearish and you look only for sells. If the two look about equal, your bias is neutral, which is a valid answer.
Write the bias down with its reasons and the date. Add what would change your mind, such as a central bank signalling the opposite policy. A day of price moving against you does not belong on that list.
Match the chart to the horizon of the view. A view built on interest rates and inflation plays out over weeks or months, so daily and 4-hour charts suit it. It has almost nothing to say about the next move on a 1-minute chart.
How does the chart time the trade?
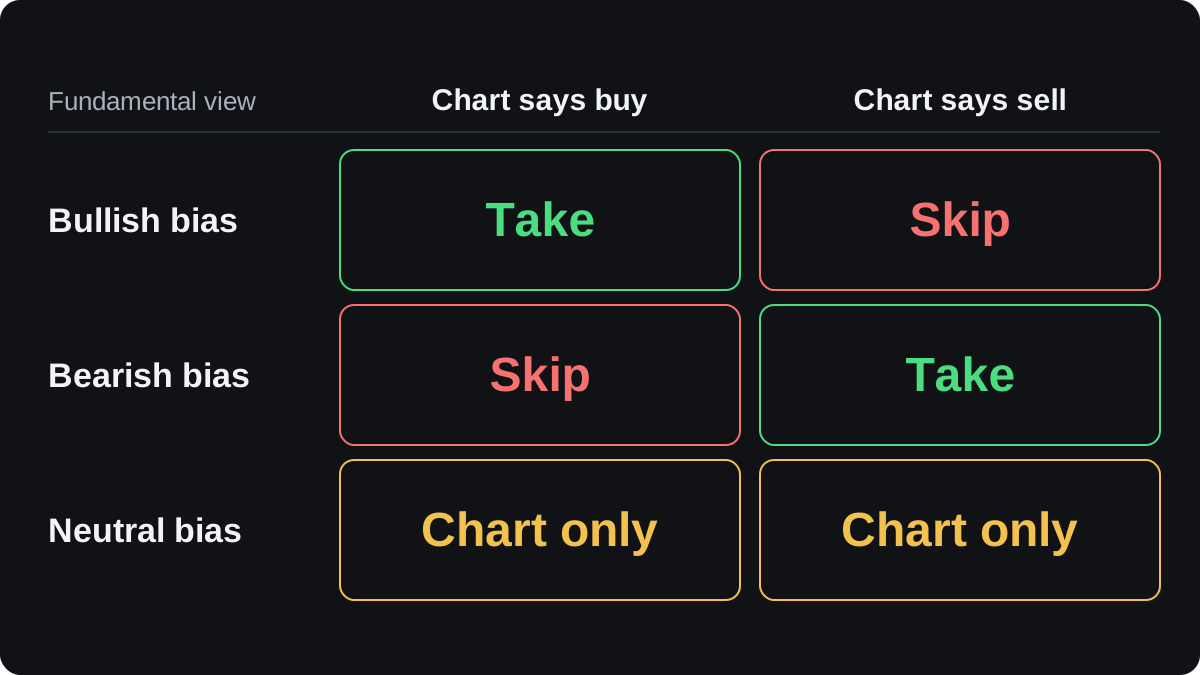
Once the bias is set, the chart works as a filter. You keep your normal technical rules, such as a bounce from support or a candle signal, and you act only on signals that point the same way as your bias.
A buy signal with a bullish bias is a trade. A sell signal with a bullish bias is skipped, however clean it looks. With a neutral bias the filter gives no help, so you either sit out or trade the chart on its own rules.
One common entry with a bullish bias is buying a pullback in an uptrend, for example when price returns to an old resistance level that has turned into support. With a bearish bias, the mirror image applies.
The filter cuts the number of trades you take. Fewer trades mean fewer spread costs and fewer decisions made in a hurry.
A worked example on EUR/USD
Here is the whole process on a daily chart with round illustrative prices. The fundamental view is assumed for the example, and none of this is a suggestion to trade EUR/USD.
- Bias. Your fundamental work says the euro should firm against the dollar. EUR is the base currency, so the bias is bullish and you look only for buys.
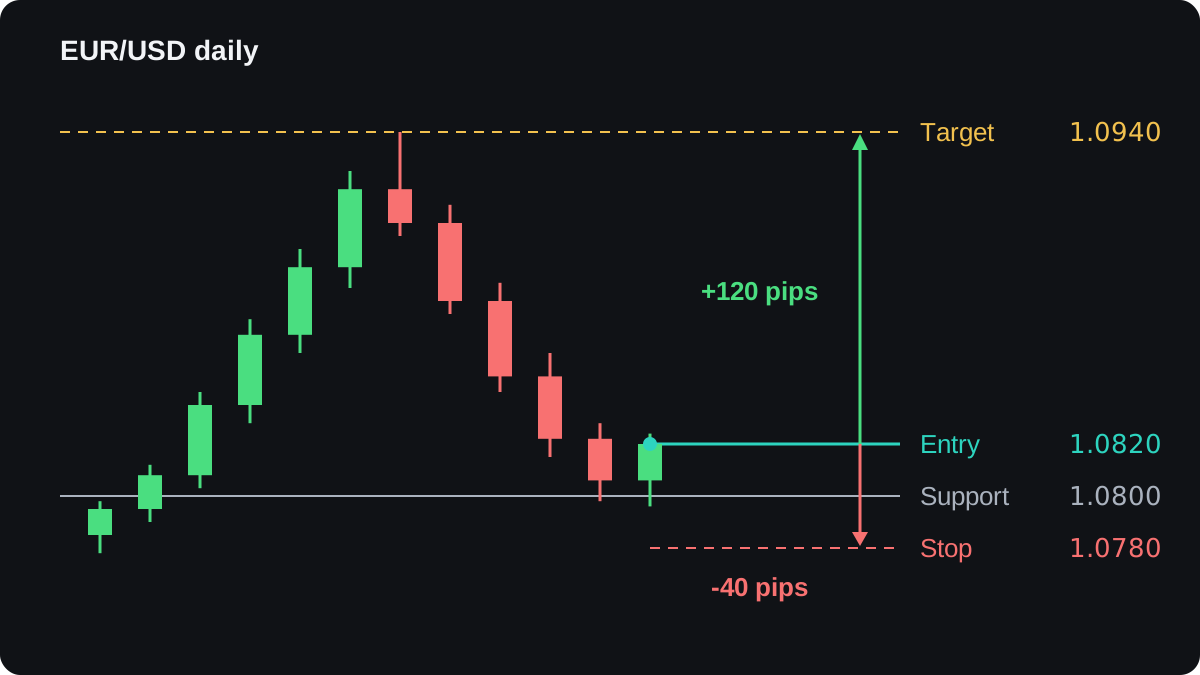
- Context. Price broke above resistance at 1.0800, rallied to a high of 1.0940 and then pulled back.
- Signal. The pullback reached 1.0800, the old resistance, and a bullish candle closed at 1.0820. You buy at 1.0820.
- Stop. You place it below the support area, at 1.0780. That is 1.0820 minus 1.0780 = 0.0040, or 40 pips.
- Target. You aim for the recent high, 1.0940. That is 1.0940 minus 1.0820 = 0.0120, or 120 pips.
Now size the trade. Say the account holds $5,000 and you risk 1% per trade, a figure picked only for this example. That is $50.
- One standard lot of EUR/USD pays $10 per pip, so you need a pip value of $50 ÷ 40 = $1.25.
- That is 1.25 ÷ 10 = 0.125 lot. Platforms usually step in 0.01 lot, so round down to 0.12 lot.
- At 0.12 lot a pip is worth $1.20. Hitting the stop loses 40 × $1.20 = $48.
- Hitting the target gains 120 × $1.20 = $144, three times the risk.
These sums use chart prices and leave out the spread and any commission, which make the real result slightly worse. The position size lesson covers the method step by step.
The fundamentals did one specific job here. During the fall from 1.0940 to 1.0800, the chart alone could have offered sell signals, and the bullish bias ruled them out.
What if the fundamentals and the chart disagree?
Say your bias is bullish, yet the pair keeps making lower highs and lower lows. The market may have priced in your reasons already, it may be reacting to something you have not weighed, or your view may be early.
The chart cannot tell you which of these is true. A cautious response is to wait until the chart lines up with the bias, and to re-check the bias itself.
Buying more as the price falls, to prove the view right, can turn a small loss into a large one.
Scheduled news is the other clash. An interest rate decision or a jobs report can move a pair sharply within minutes, and your stop can be filled at a worse price than you set, which is called slippage.
Check the economic calendar before you enter. Markets react to the gap between the result and the forecast, so even a strong number can push a currency down if traders expected more.
Where does this approach fail?
The method sounds tidy, but solid public evidence that it improves retail results is hard to find. Most claims you will read are anecdotes or backtests chosen after the fact.
Confirmation bias is the usual trap. Once you hold a view, every chart pattern starts to look like proof of it, and signals that disagree are easy to explain away.
A fundamental view can also be wrong, or right and still lose money because you acted late. Prices often move before the news that explains them, since markets trade on expectations.
Treat the combined method as a set of rules to test. Run it on a demo account and record every trade, including the ones the filter made you skip, so you can see whether the filter helped.
คำถามที่พบบ่อย
Should I use fundamental or technical analysis?
You do not have to pick only one. Each can be used on its own, and combining them is a middle option you can test on a demo account.
Do fundamentals matter for day trading?
Mostly through scheduled news. A view that plays out over months has little effect on a 15-minute chart, but a release during your session can move price sharply, so check the calendar first.
What timeframe suits combining both?
Daily and 4-hour charts usually fit, because they move on a horizon closer to that of a fundamental view. Match the chart to how long you plan to hold the trade.
Why did a currency fall after good news?
The result may have been weaker than the forecast, or the good news may already have been priced in. Markets move on the surprise relative to expectations.
เรียนต่อ
 บทที่ 4Building a fundamental view of a currency.A fundamental view is a written judgement of whether an economy's data favour its currency. A simple method scores three pillars, growth, inflation and central bank policy, from -2 to +2 each, based on direction and surprises. Comparing two totals shows which currency the data lean toward, though prices often move for other reasons.
 บทที่ 4Pairing a strong currency with a weak one.A currency pair moves on the gap between its two currencies, so a correct view on one currency can still give a flat trade. Pairing a currency you expect to strengthen with one you expect to weaken lets both forces push the price the same way, though each half of that view is a forecast that can fail.

