How volatile is crypto?
Crypto is one of the most volatile markets you can trade. Even the largest coins can move several percent in a day, smaller coins usually move more, and Bitcoin has fallen more than 70% from a peak more than once. You measure volatility as the usual size of moves in percent, which lets you compare any two coins.
Nội dung này hiện chỉ có bản tiếng Anh.

Say a coin opens at 50,000 dollars, drops to 48,500 by noon and ends the day near 51,000. In most markets that would be a dramatic day. In crypto it happens often.
Volatility is the size of those swings: how far price usually travels over a given period. It says nothing about direction. A coin can be very volatile and still end the month where it started.
Every price in this lesson is a round number chosen for illustration.
What does volatility mean for your money?
Volatility sets how much a position gains or loses on a normal day. A 6% move on a $1,000 position is $60. The same move on a $20,000 position is $1,200.
Stops therefore need more room, and positions must be smaller for the same risk. Borrowed money multiplies the swing on top of that. The lessons on sizing a crypto position and leverage on crypto CFDs work through both.
Over its history, crypto has swung far more than major currencies or large stock indices. Bitcoin, the largest coin, has fallen more than 70% from a peak more than once. Smaller coins have usually swung harder still.
Stablecoins are built to avoid this: they aim to hold a steady price, usually one dollar. They can still lose that peg, as the stablecoin lesson explains.
Why does crypto swing so much?
A share comes with company earnings, and a bond pays interest. Those cash flows give buyers a rough sense of fair value. Most coins pay neither, so price rests on what buyers expect, and expectations can change in an afternoon.
Liquidity is the second reason. Smaller coins often have few orders waiting in the order book, so one large sale pushes through several price levels before it fills. The lesson on crypto liquidity shows how thin books move.
Borrowed money adds fuel. Many traders hold leveraged futures or CFDs, and when price moves against them their positions close automatically. Those forced sales push price further, and the next group of positions closes in turn.
The market also never shuts. News that lands at 3 a.m. on a Sunday meets a quiet market with fewer orders to absorb it. See when the crypto market trades for how activity shifts through the week.
How do you measure a coin's daily move?
Start with one day. A coin opens at 50,000, trades as high as 51,500 and as low as 48,500. The range from low to high is 3,000, and 3,000 ÷ 50,000 = 6% of the opening price.
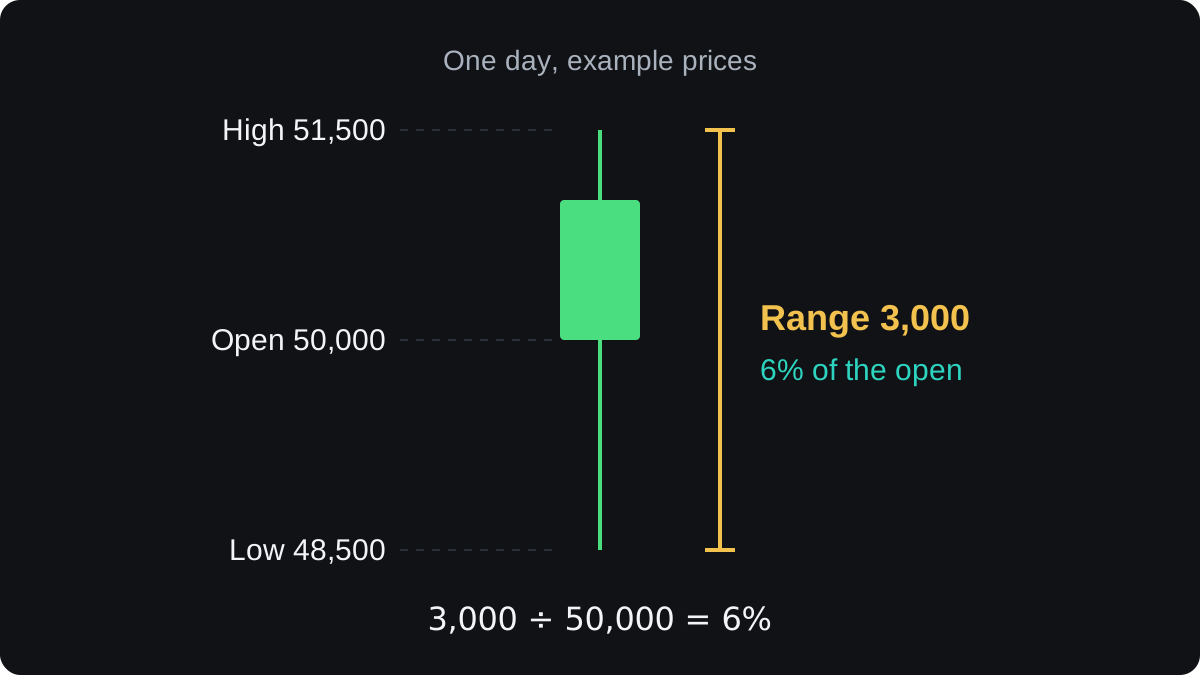
Percent lets you compare coins at any price. A 3,000 move on a 50,000 coin is 6%, and a 0.08 move on a 1.00 coin is 8%, so the coin priced at 1.00 moved more.
One day says little, so repeat the sum and take an average. Here are five illustrative days: 3%, 7%, 3%, 9% and 3%.
They add up to 25%, and 25 ÷ 5 = 5%. This coin usually covers about 5% from its low to its high each day.
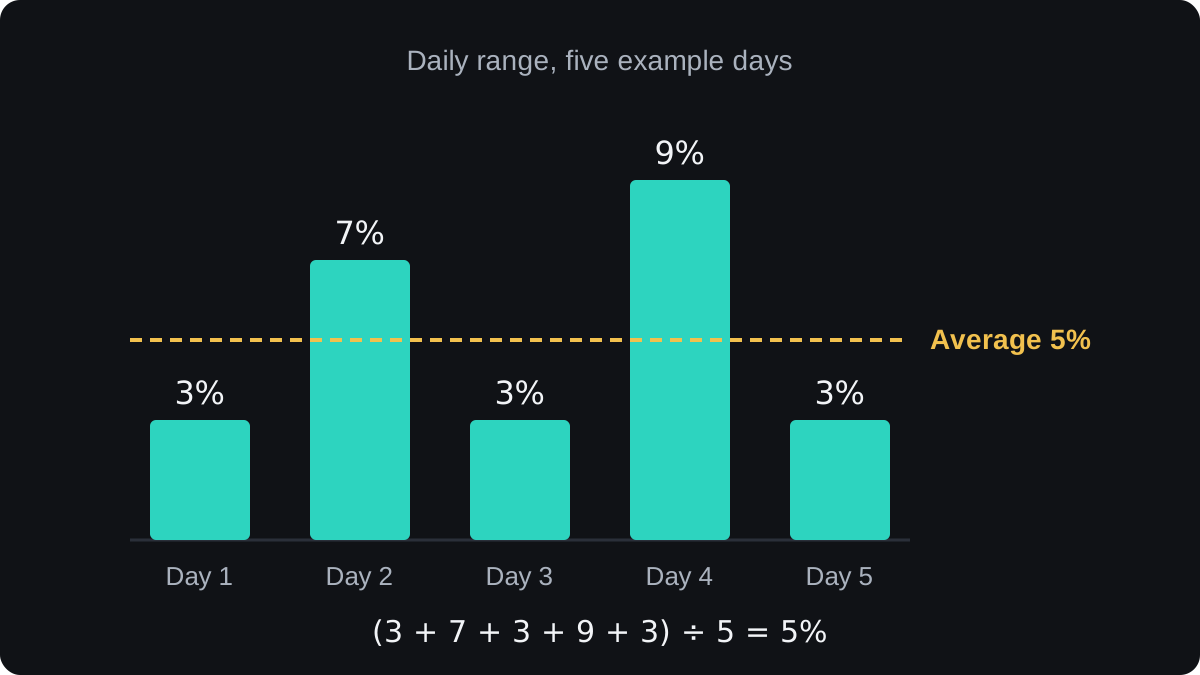
Average true range (ATR) does the same job and also counts gaps between one candle and the next. The forex lesson on measuring volatility shows how ATR is calculated.
To use ATR on crypto, divide it by price. An ATR of 2,500 on a coin at 50,000 is 2,500 ÷ 50,000 = 5%.
What does an annualised volatility figure mean?
Data sites and research notes often quote volatility as one yearly percentage. That figure is usually the standard deviation of daily returns, a measure of how spread out the daily changes are, scaled up to a year.
Say a coin's daily standard deviation is 3%. On most days its change from one close to the next lands within about 3% either way, and a minority of days land further out.
To scale a daily figure to a year, multiply it by the square root of the number of trading days in a year. Crypto trades every day, so the usual choice is 365, whose square root is about 19.1.
That turns 3% a day into 3% × 19.1, about 57% a year. Some sources use 252 days, the usual count for stock markets, and get 3% × 15.9, about 48%. Check the method before you compare two published figures.
Read 57% as a summary of past daily swings, scaled to a year. Price can end the year almost flat with that figure, or a long way from where it started.
Why does volatility come in waves?
Volatility clusters. Calm weeks tend to follow calm weeks, and violent days tend to bunch together. A coin can move 2% a day for a month, then switch to 7% a day after one piece of news.
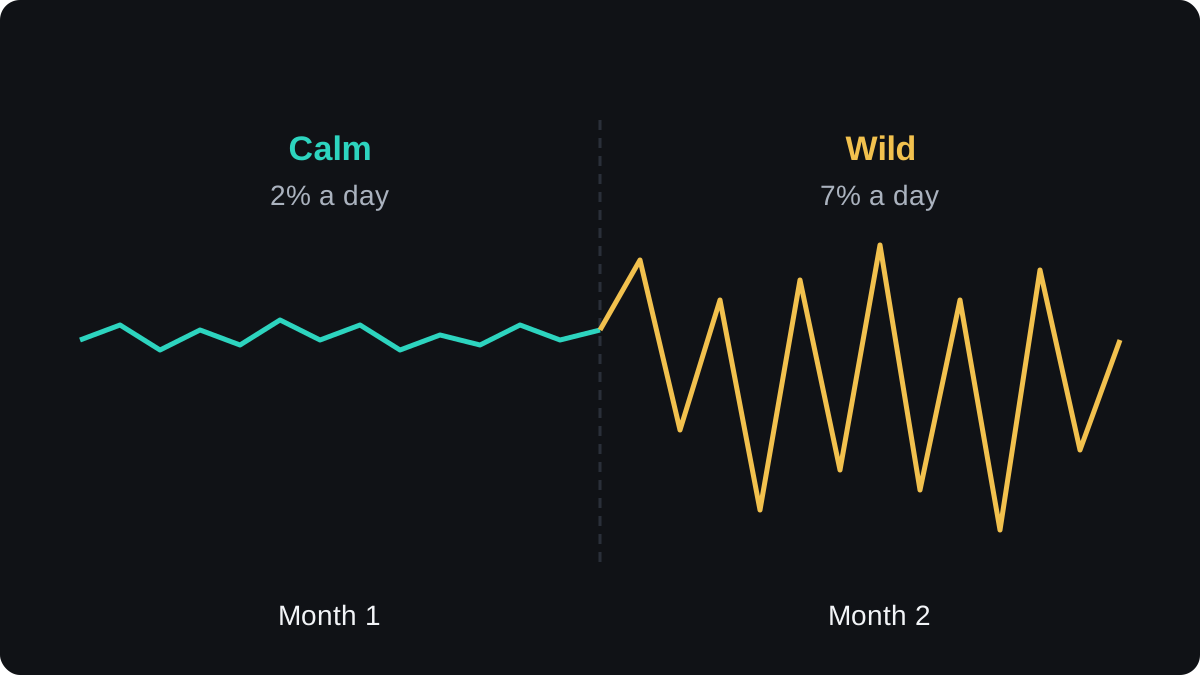
So a stop distance that suited last month may sit inside today's normal noise. Measure again before each trade, and size the position from the current figure.
Where do volatility numbers fall short?
Every measure here looks backwards. It tells you how a coin moved, and the next month can be calmer or far wilder.
Crypto also has fat tails: extreme days come more often than a bell curve predicts. A coin with a 3% daily figure can still fall 20% in a single day.
Some of the worst losses in crypto come from events, with no warning in the price. An exchange can fail, a project can be hacked or a stablecoin can lose its peg, and ATR shows none of it.
Gaps matter on CFDs. If a broker pauses crypto trading for part of the weekend, price can reopen far from where it stopped, as the lesson on trading crypto CFDs at weekends explains.
Câu hỏi thường gặp
Is crypto more volatile than forex?
Yes, as a rule. Major coins have usually moved several times as much as major currency pairs on a typical day, and smaller coins more than that.
Which cryptocurrency is the least volatile?
Stablecoins, because they are built to hold one price, usually one dollar. Among other coins, the largest have usually been calmer than small ones, though that order can change.
How can I check a coin's volatility myself?
Add an ATR indicator to a daily chart and divide its value by the price to get a percentage. Compare the result with the same coin a few months earlier and with other coins you trade.
Does high volatility mean the price will fall?
No. Volatility measures the size of moves in both directions, so a coin can be highly volatile while it rises.
Học tiếp
 Chương 3How to size a crypto position.To size a crypto position, divide the money you accept losing by the distance from your entry to your stop. With $100 at risk, an entry at 50,000 and a stop at 47,500, you buy 100 ÷ 2,500 = 0.04 coin, a position worth $2,000. Round down to the exchange's order step and allow for fees.
 Chương 3Risk management for crypto traders.Crypto risk management is a set of limits fixed before you trade: how much one trade can lose, how much all open trades can lose together, how much leverage you use and where you keep your coins. It matters more in crypto because prices move fast and some losses, such as an exchange failure, never show on a chart.

