What is NUPL?
NUPL, net unrealized profit and loss, measures how much paper profit or loss all holders of a coin are sitting on, as a share of market cap. It equals market cap minus realized cap, divided by market cap. A positive reading means holders are in profit overall; a negative one means the market trades below its on-chain cost basis.
Nội dung này hiện chỉ có bản tiếng Anh.

Take an illustrative market with three coins at a price of $50,000. They last moved on-chain at $20,000, $40,000 and $60,000. On paper, the first holder is up $30,000, the second is up $10,000 and the third is down $10,000.
Net, the three holders are up $30,000. Divide that by the market cap of $150,000 and you get 0.20, the market's NUPL.
What NUPL measures
NUPL stands for net unrealized profit and loss. Unrealized means the profit or loss exists only on paper, because the coins have not been sold. It is the same idea as the floating profit and loss of an open trade.
Market cap values every coin at today's price. Realized cap values every coin at the price when it last moved, as the on-chain cost basis lesson explains.
The formula is NUPL = (market cap minus realized cap) ÷ market cap. The gap on top of the fraction is the total paper profit or loss of all holders.
Worked example
Using the same three illustrative coins:
- Market cap = 3 × $50,000 = $150,000.
- Realized cap = $20,000 + $40,000 + $60,000 = $120,000.
- Net unrealized profit = $150,000 minus $120,000 = $30,000.
- NUPL = $30,000 ÷ $150,000 = 0.20.
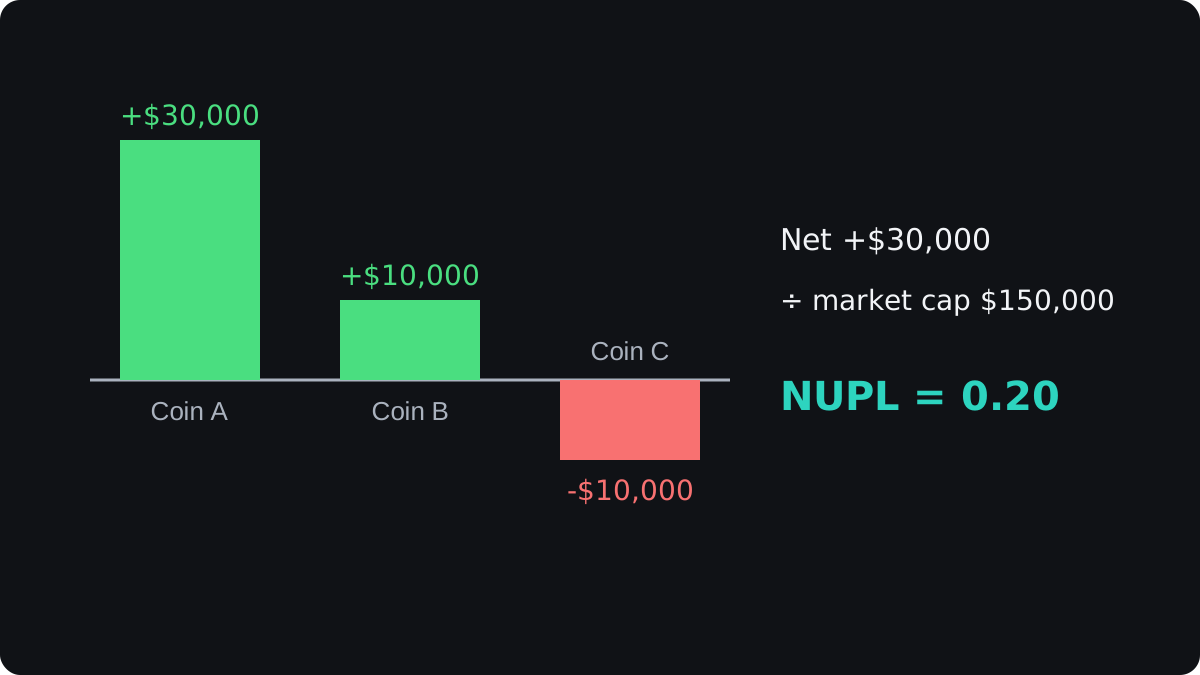
This matches the coin by coin count from the start: $30,000 plus $10,000 minus $10,000 = $30,000.
Reading the NUPL scale
NUPL can never reach 1, because that would need a realized cap of zero. It has no fixed floor below 0, and it turns negative whenever the market trades under its average cost basis.
Keep the same three coins and change only the price. At $30,000, the market cap is $90,000, and NUPL = ($90,000 minus $120,000) ÷ $90,000 = -0.33.
At $100,000, the market cap is $300,000, and NUPL = ($300,000 minus $120,000) ÷ $300,000 = 0.60.
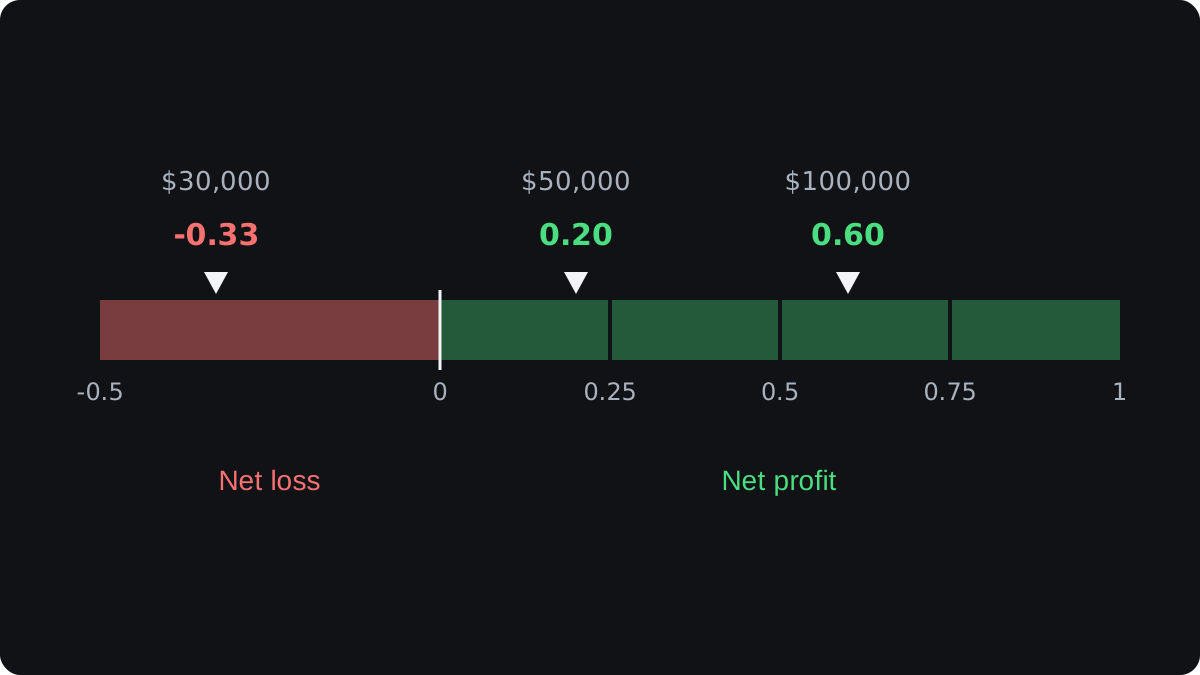
Many charts colour NUPL in bands, with edges at or near 0, 0.25, 0.5 and 0.75, and give each band a mood name that runs from capitulation up to euphoria.
The edges are conventions taken from past cycles, and they vary from chart to chart. Price has spent long periods inside each band, and no edge reliably marks a top or a bottom.
How traders use NUPL
High NUPL means holders as a group are sitting on large paper gains, so more coins could be sold at a profit. On Bitcoin, NUPL has been high near past cycle peaks.
Negative NUPL means holders as a group are under water. On Bitcoin, that has happened in the late stages of past declines.
Traders read NUPL as a measure of how stretched the market is. On its own it is no timing signal: it can stay high for months while price keeps rising, and stay negative for months while price goes sideways.
Providers also split NUPL by coin age into short-term holder NUPL and long-term holder NUPL, each built from that group's own cost basis.
NUPL is linked to MVRV by a simple identity: NUPL = 1 minus 1 ÷ MVRV. The MVRV lesson covers the ratio itself.
In the example, MVRV is $150,000 ÷ $120,000 = 1.25, and 1 minus 1 ÷ 1.25 = 1 minus 0.80 = 0.20.
What NUPL hides
NUPL is a net figure, so big gains and big losses can cancel out. Two markets can show the same NUPL with very different holders.
In this illustrative pair, both markets trade at $50,000 and have a realized cap of $120,000. In market A, all three coins last moved at $40,000, so each holder is up $10,000.
In market B, the coins last moved at $5,000, $35,000 and $80,000. Those holders are up $45,000, up $15,000 and down $30,000.
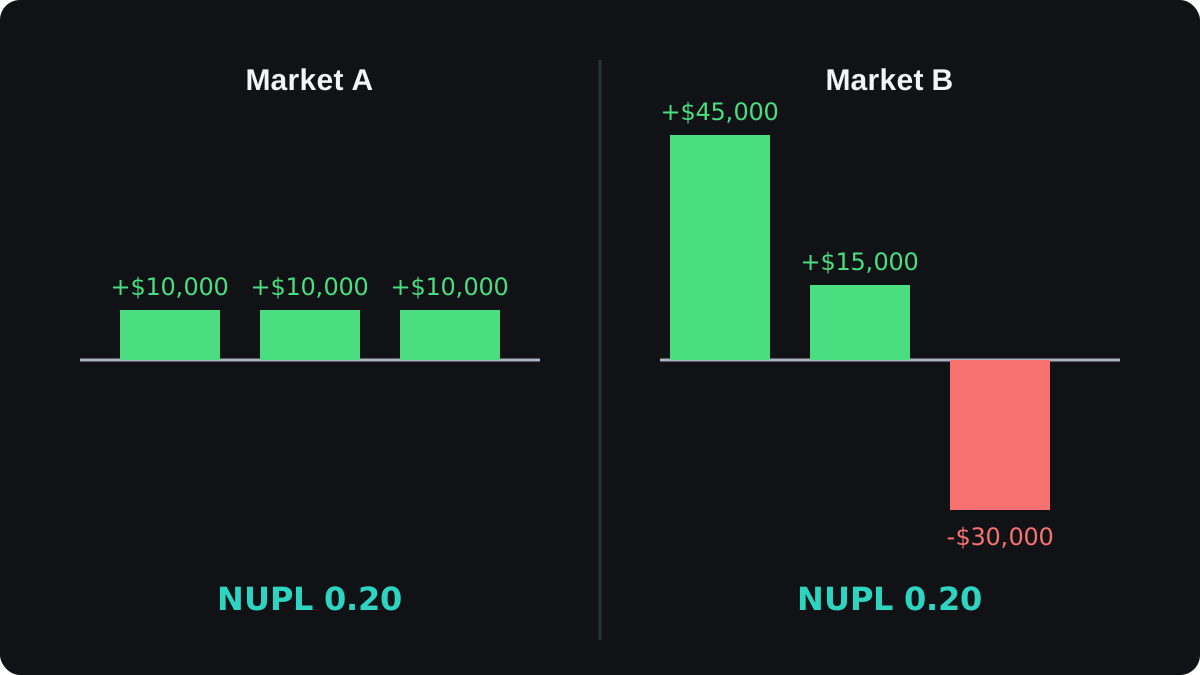
Both nets are $30,000, so both NUPLs are 0.20. Market B, though, has one deeply losing holder who might sell into any rally. Some providers chart unrealized profit and unrealized loss separately for this reason.
Where NUPL misleads
NUPL inherits every weakness of realized cap. Coins moved between a holder's own wallets reset their cost, and trades inside exchanges never reach the chain.
Coins lost in the early years keep a cost basis close to zero, which inflates the paper profit. Providers label wallets and handle these effects differently, so the same day can show different NUPL readings.
The market has also changed, with ETFs and custodians holding coins for many owners, so levels from early cycles may not repeat. Read NUPL as one view of holder positioning next to price and market cycles.
Câu hỏi thường gặp
What is a good NUPL level to buy at?
No level is a reliable buy point. Negative NUPL has come near past lows, but it can stay negative for a long time and fall further, so it describes conditions rather than timing.
What is the difference between NUPL and MVRV?
They use the same two inputs, market cap and realized cap. MVRV is the ratio of the two, and NUPL is the gap as a share of market cap, so NUPL = 1 minus 1 ÷ MVRV.
Can NUPL be negative?
Yes. NUPL is negative when market cap is below realized cap, which means holders as a whole would lose money if they all sold at today's price.
What is unrealized profit in crypto?
It is the gain on coins you still hold, measured against what you paid. It becomes realized profit only when you sell.
Học tiếp
 Chương 2What is on-chain analysis?On-chain analysis is the study of a blockchain's public records, such as transfers, balances and the age of coins, to see how holders behave. Data providers turn raw transactions into metrics like exchange flows and realized price. It adds context about supply and holder profit, but it cannot tell you when to trade.
 Chương 2Spot volume and volume delta.Spot volume is the amount of a coin traded for immediate delivery over a period. Volume delta splits that volume by who started each trade: volume from market buy orders minus volume from market sell orders. A positive delta means buyers were the more aggressive side, which is different from saying there were more buyers.
 Chương 2Exchange flows and exchange balances.Exchange flows track coins moving onto and off known exchange addresses. Inflows arrive, outflows leave, and netflow is inflow minus outflow. Exchange balance is the total held at those addresses, often shown as a share of supply. Rising balances can mean coins ready to sell, but every figure depends on how well a provider labels exchange wallets.
 Chương 2What is on-chain cost basis?On-chain cost basis estimates what holders paid by valuing each coin at the price on the day it last moved on the blockchain. Add those values up and divide by the supply, and you get the realized price, the average cost of the whole market. Split by coin age, it gives a separate cost for short-term and long-term holders.
 Chương 2What is SOPR?SOPR, the spent output profit ratio, compares what coins were worth when spent on-chain with what they were worth when last received. Above 1 means the coins that moved were spent at a profit on average; below 1 means at a loss. Traders watch how SOPR behaves around 1 to see whether holders are taking profits or giving up.
 Chương 2What is MVRV, and how do traders read it?MVRV, market value to realized value, divides a coin's market cap by its realized cap, which values each coin at the price when it last moved. A reading of 1.25 means holders are up 25% on average, and below 1 means they are at a loss. Traders use MVRV and its holder-age versions to judge how stretched valuations are.
 Chương 2What is the MVRV Z-score?The MVRV Z-score measures how far a coin's market cap sits above or below its realized cap, in units of the standard deviation of market cap over its history. The formula is market cap minus realized cap, divided by that standard deviation. High readings mean an unusually stretched market; readings below 0 mean price is under the average on-chain cost.

