What is SOPR?
SOPR, the spent output profit ratio, compares what coins were worth when spent on-chain with what they were worth when last received. Above 1 means the coins that moved were spent at a profit on average; below 1 means at a loss. Traders watch how SOPR behaves around 1 to see whether holders are taking profits or giving up.
Nội dung này hiện chỉ có bản tiếng Anh.
Suppose four illustrative coins move on the blockchain today, when the price is $50,000. They were received at $20,000, $40,000, $50,000 and $50,000. The day's spending turned $160,000 of entry value into $200,000.
$200,000 ÷ $160,000 = 1.25. That ratio is the day's SOPR.
What SOPR measures
SOPR stands for spent output profit ratio. It compares the dollar value of coins when they are spent with their dollar value when they were created, across all coins spent in a period.
The formula is total value when spent ÷ total value when created. In Bitcoin terms, each spent output is a piece of coin received in one transaction and spent in a later one.
SOPR uses the same idea as on-chain cost basis: the price when a coin last moved stands in for what the holder paid.
It counts only coins that moved in the period, so it measures profit and loss that holders actually locked in.
Worked example
These numbers are illustrative.
- Four coins are spent at $50,000 each. Value when spent: 4 × $50,000 = $200,000.
- Value when created: $20,000 + $40,000 + $50,000 + $50,000 = $160,000.
- SOPR = $200,000 ÷ $160,000 = 1.25.
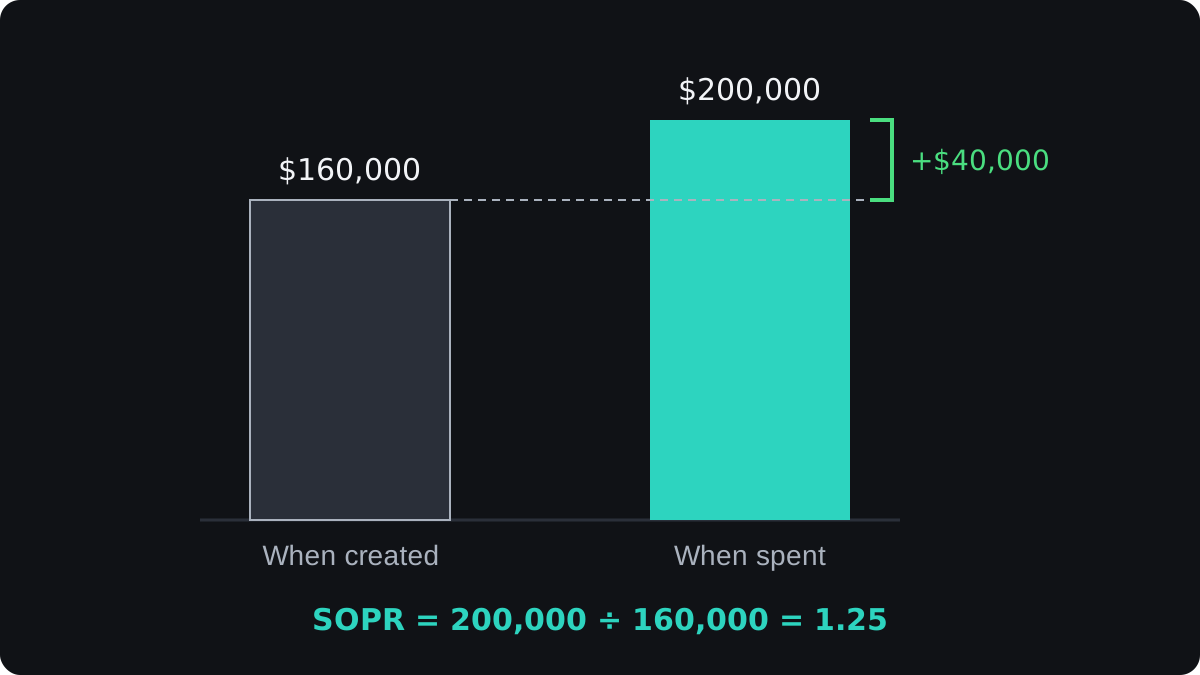
On average, every dollar of entry value was spent at $1.25. Two coins carried big gains and two moved at breakeven, but SOPR reports only the total.
On a second illustrative day, the price is $40,000 and two coins move, both received at $50,000. Value when spent is 2 × $40,000 = $80,000, and value when created is $100,000.
SOPR = $80,000 ÷ $100,000 = 0.80. The coins that moved that day were spent at a 20% loss on average.
Reading SOPR above and below 1
A SOPR of exactly 1 means coins moved at breakeven on average. Above 1, the coins spent that day were in profit. Below 1, they were spent at a loss, which often means some holders gave up.
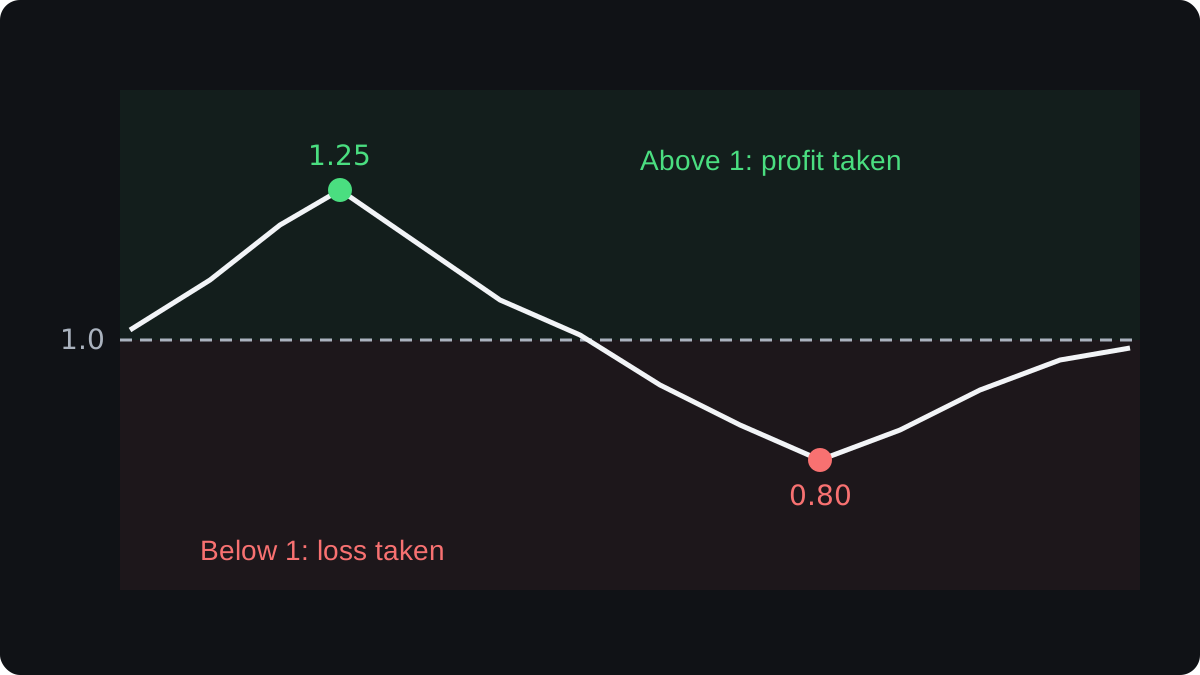
The line at 1 matters because of how people behave. Many holders dislike selling at a loss. In an uptrend, when price dips and SOPR falls toward 1, selling tends to dry up and SOPR turns back up.
In a downtrend, holders who bought higher often sell as soon as they are back to breakeven. Rallies then push SOPR up to about 1, where it tends to stall.
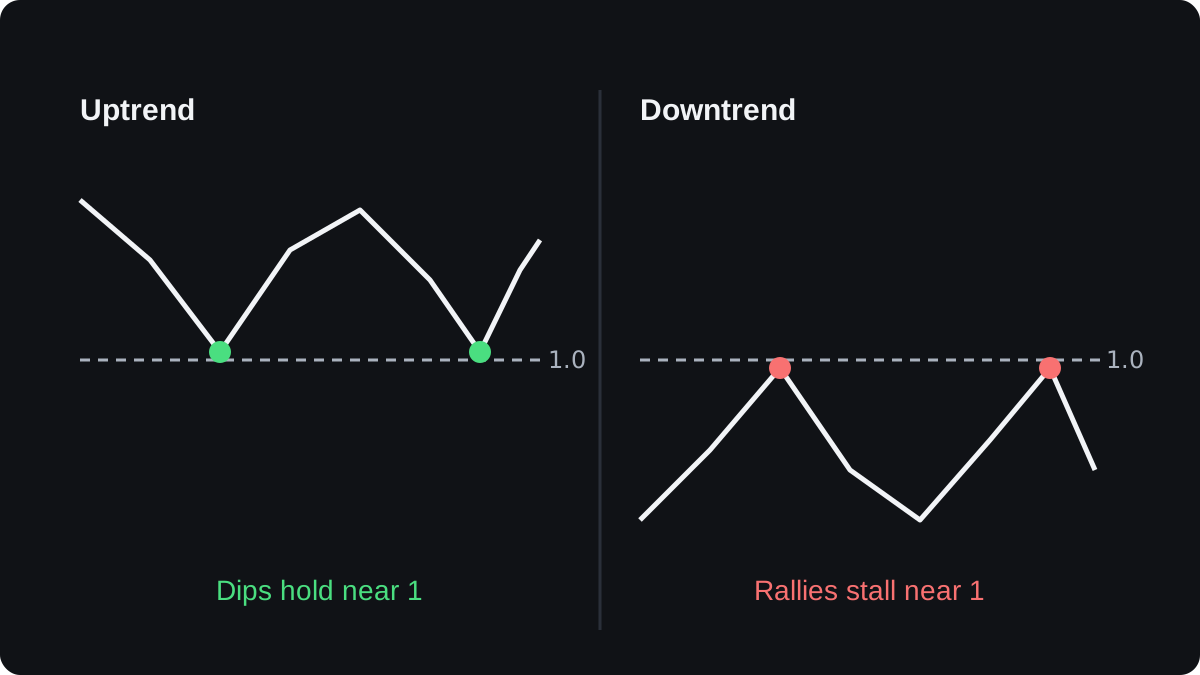
The line at 1 works a little like support and resistance inside the metric itself. It is a tendency only, and in sideways markets SOPR crosses 1 back and forth for long stretches.
Variants you will see
Raw SOPR includes every spent output, even coins that change hands within minutes. Those moves are mostly noise, so some providers publish an adjusted SOPR that leaves out outputs younger than about one hour.
Short-term holder SOPR counts only coins that had sat still for less than a set time, often about 155 days. Long-term holder SOPR counts the older coins.
Recent buyers react fast to price, so their SOPR swings around 1 more often. Long-term holders tend to spend in profit, and their SOPR can stay well above 1 for months.
Charts often smooth SOPR with a moving average, such as 7 days, because daily readings jump around.
Where SOPR misleads
SOPR is weighted by value, so a handful of large outputs can move it. One holder moving a large amount of old coins at a big gain can lift a whole day's reading.
Not every spend is a sale. Moving coins between your own wallets, or an exchange reorganising its wallets, counts as a spend and resets the coin's cost.
Providers filter some of these moves with address clustering and their own wallet labels, using different rules, so their SOPR lines differ.
Trades between customers inside an exchange do not show at all, because no coins move on the chain. SOPR sees only what the blockchain records.
SOPR describes what holders already did, so it is no timing signal on its own. A reading below 1 can last for weeks in a falling market, so treat it as context and keep your risk management in charge of entries and exits.
Câu hỏi thường gặp
What does SOPR below 1 mean?
The coins spent in that period were, on average, sold for less than their value when they were last received. Holders who moved coins that day locked in a loss.
What is the difference between SOPR and aSOPR?
aSOPR is adjusted SOPR. It leaves out outputs spent within about an hour of being created, which removes much of the noise from fast transfers.
Is SOPR a buy signal when it drops below 1?
No single SOPR reading is a signal on its own. Dips below 1 have come before recoveries and also before deeper falls, so traders combine it with price and their own plan.
Does SOPR work for coins other than Bitcoin?
It fits Bitcoin best, because every coin piece has a clear creation and spend. On account-based chains such as Ethereum, providers estimate it with their own methods, so readings differ between sources.
Học tiếp
 Chương 2What is on-chain analysis?On-chain analysis is the study of a blockchain's public records, such as transfers, balances and the age of coins, to see how holders behave. Data providers turn raw transactions into metrics like exchange flows and realized price. It adds context about supply and holder profit, but it cannot tell you when to trade.
 Chương 2Spot volume and volume delta.Spot volume is the amount of a coin traded for immediate delivery over a period. Volume delta splits that volume by who started each trade: volume from market buy orders minus volume from market sell orders. A positive delta means buyers were the more aggressive side, which is different from saying there were more buyers.
 Chương 2Exchange flows and exchange balances.Exchange flows track coins moving onto and off known exchange addresses. Inflows arrive, outflows leave, and netflow is inflow minus outflow. Exchange balance is the total held at those addresses, often shown as a share of supply. Rising balances can mean coins ready to sell, but every figure depends on how well a provider labels exchange wallets.
 Chương 2What is on-chain cost basis?On-chain cost basis estimates what holders paid by valuing each coin at the price on the day it last moved on the blockchain. Add those values up and divide by the supply, and you get the realized price, the average cost of the whole market. Split by coin age, it gives a separate cost for short-term and long-term holders.
 Chương 2What is NUPL?NUPL, net unrealized profit and loss, measures how much paper profit or loss all holders of a coin are sitting on, as a share of market cap. It equals market cap minus realized cap, divided by market cap. A positive reading means holders are in profit overall; a negative one means the market trades below its on-chain cost basis.
 Chương 2What is MVRV, and how do traders read it?MVRV, market value to realized value, divides a coin's market cap by its realized cap, which values each coin at the price when it last moved. A reading of 1.25 means holders are up 25% on average, and below 1 means they are at a loss. Traders use MVRV and its holder-age versions to judge how stretched valuations are.
 Chương 2What is the MVRV Z-score?The MVRV Z-score measures how far a coin's market cap sits above or below its realized cap, in units of the standard deviation of market cap over its history. The formula is market cap minus realized cap, divided by that standard deviation. High readings mean an unusually stretched market; readings below 0 mean price is under the average on-chain cost.

