What is on-chain analysis?
On-chain analysis is the study of a blockchain's public records, such as transfers, balances and the age of coins, to see how holders behave. Data providers turn raw transactions into metrics like exchange flows and realized price. It adds context about supply and holder profit, but it cannot tell you when to trade.

Picture an illustrative day on the Bitcoin network. Coins that have not moved for six years are sent to an address labelled as a large exchange's wallet.
Anyone in the world can see that transfer within minutes, because the record is public. What it means is a harder question.
The owner may plan to sell. They may also be moving coins to a custodian, or the exchange may be reorganising its own wallets. On-chain analysis is the work of answering that question carefully.
What the blockchain shows you
A blockchain records every confirmed transaction: the amount, the sending and receiving addresses, the fee and the block it landed in. On Bitcoin, each coin can also be traced back to the transaction that created it.
On-chain analysis is the study of that record to describe how coins move and who is likely to hold them. The word on-chain means the data comes from the blockchain itself, which anyone can read.
The record has no names. It shows addresses, and one person or company can control thousands of them. Most of the work in on-chain analysis is grouping and labelling addresses so the numbers mean something.
From raw blocks to a metric
Data providers run full nodes, computers that keep a complete copy of the chain. They read every block and group addresses that seem to share an owner.
They also tag known entities such as exchanges and miners. Then they boil the result down to one number per day or per hour.
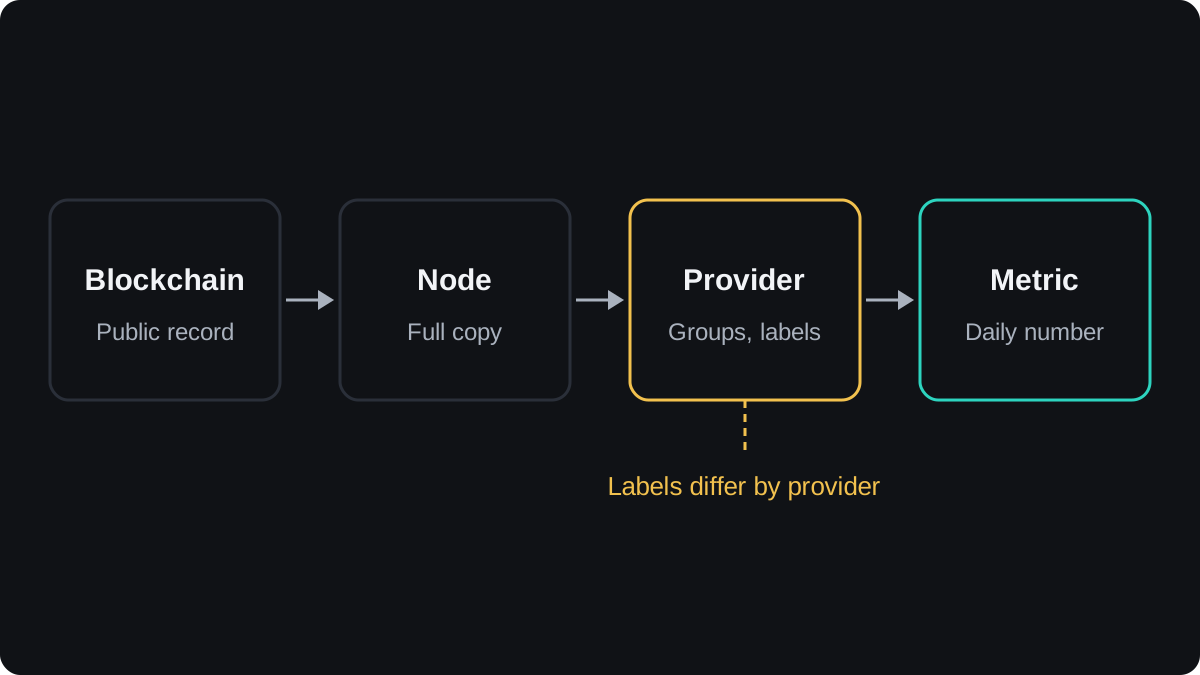
Grouping relies on rules of thumb, which are usually right and sometimes wrong. A common one: when one transaction spends coins from several addresses, those addresses probably share an owner, because one wallet signed for all of them.
Some transactions pool coins from many users on purpose to break exactly this rule, so providers have to spot those too.
Labels come from each provider's own research, such as test deposits, public disclosures and patterns of behaviour. Two providers rarely hold the same label list, so the same metric can differ between them.
Worked example: removing same-owner transfers
The numbers below are illustrative.
- On one day, the chain shows 50,000 BTC moving between addresses.
- A provider recognises that 35,000 BTC of it is one exchange shifting coins from a hot wallet to its own cold storage.
- That transfer changes no ownership, so the provider removes it.
- Adjusted transfer volume is 50,000 minus 35,000 = 15,000 BTC. The 35,000 BTC removed is 35,000 ÷ 50,000 = 70% of the raw figure.
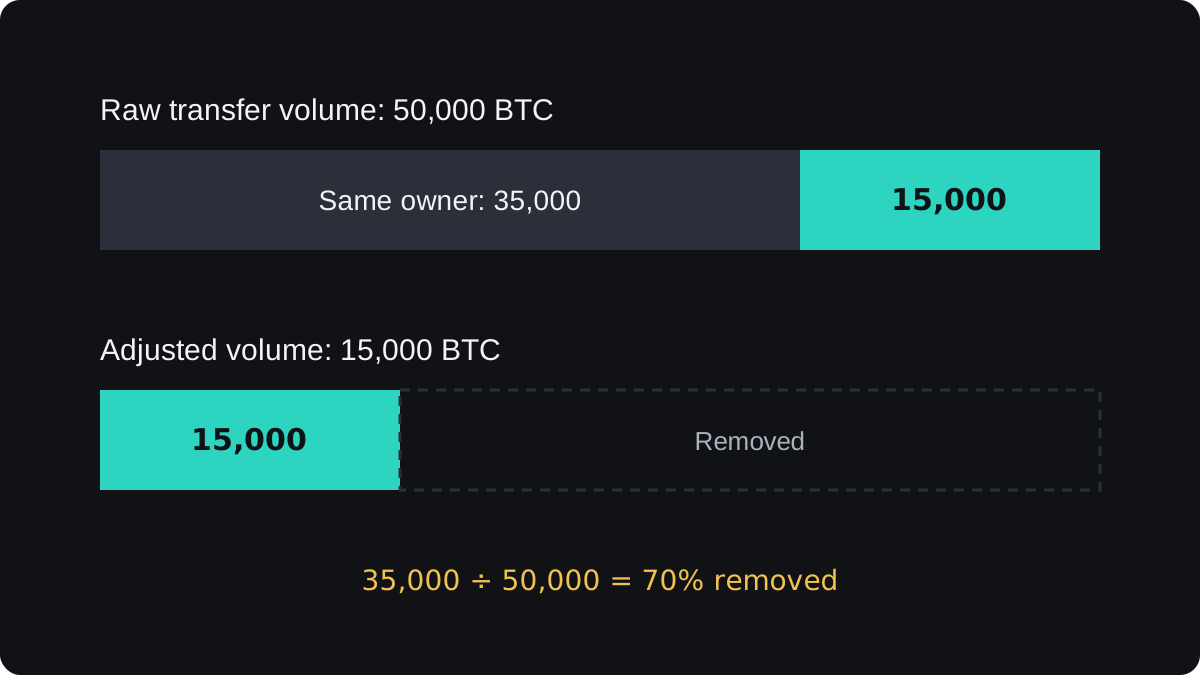
A chart built from the raw number would show a busy day. The adjusted chart shows an ordinary one. Both are honest descriptions of the data, so you need to know which one you are reading.
The main families of on-chain metrics
Most on-chain metrics answer one of four questions.
- How much is the network used? Activity metrics count transactions, active addresses and fees.
- Are coins arriving at exchanges or leaving them? The lesson on exchange flows and balances covers this family.
- Are coins held by long-term holders or recent buyers? Holder-age metrics rest on when each coin last moved.
- Are holders sitting on gains or losses? These metrics use on-chain cost basis, which feeds ratios such as MVRV, NUPL and SOPR.
Spot volume often appears on the same dashboards, though it comes from exchange trade data rather than the chain. The spot volume lesson explains the difference.
What the chain cannot see
Say you deposit 5 BTC on a centralised crypto exchange, sell 1 BTC to another customer, and later withdraw 2 BTC. The chain records the deposit and the withdrawal. The trade in between exists only in the exchange's own database.
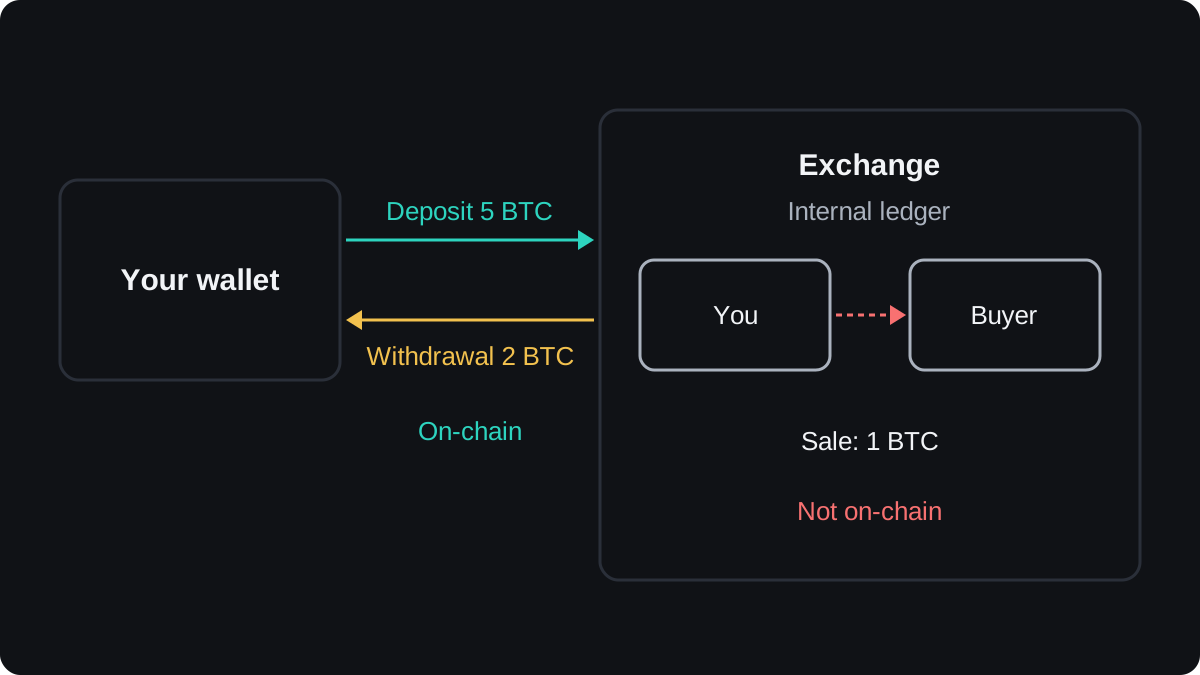
This blind spot is large. Trades between customers of a centralised exchange never touch the chain, and neither do futures or CFDs. Coins held for spot ETFs sit with custodians and move only when the custodian chooses.
Layer 2 networks and wrapped coins on other chains add more gaps. A payment on Bitcoin's Lightning Network, a second layer, never appears on the main chain. Only the opening and closing of the payment channel do.
Where on-chain data misleads
Labels go stale. An exchange opens new wallets, and until a provider tags them, coins sent there look as if they left the exchange. Providers also revise old data when labels change, so a chart can look different next month.
The market changes shape over time. Exchanges, ETFs and custodians now hold coins for many users, so one address can stand for thousands of people. Readings that matched turning points in an earlier cycle may not match now.
A metric is also no timing signal on its own. A big inflow to an exchange can come before heavy selling, or before nothing at all.
Traders use on-chain readings as background for fundamental analysis. They time entries with price and technical analysis.
How traders put it to work
A sensible way in is to ask one question at a time, such as whether coins are flowing to exchanges or whether recent buyers are sitting on losses.
Each answer describes the holders behind the price. If recent buyers sit on heavy losses, rallies may meet sellers who want out at breakeven. That is context for a plan, and price still has the final say.
Before you compare two charts, check which provider made each one, which labels it uses and which version of the metric it shows.
Questions
Is on-chain analysis the same as fundamental analysis?
It is one part of crypto fundamental analysis. Fundamentals also cover the project, its supply rules, its users and the wider economy, while on-chain data covers what the blockchain records.
Can on-chain analysis predict the price?
No metric predicts price on its own. On-chain data describes how holders are positioned, and positions can stay stretched for months before price reacts.
Is on-chain data free?
The raw blockchain is free to read for anyone who runs a node or uses a block explorer. Labelled and processed metrics usually come from data providers, and many charge for finer detail, such as hourly data or a longer history.
Does on-chain analysis work for every coin?
It works best on chains with long, public histories, such as Bitcoin. Privacy coins hide amounts or addresses, and tokens spread across exchanges and several chains give a patchy picture.
Keep learning
 Chapter 2Spot volume and volume delta.Spot volume is the amount of a coin traded for immediate delivery over a period. Volume delta splits that volume by who started each trade: volume from market buy orders minus volume from market sell orders. A positive delta means buyers were the more aggressive side, which is different from saying there were more buyers.
 Chapter 2Exchange flows and exchange balances.Exchange flows track coins moving onto and off known exchange addresses. Inflows arrive, outflows leave, and netflow is inflow minus outflow. Exchange balance is the total held at those addresses, often shown as a share of supply. Rising balances can mean coins ready to sell, but every figure depends on how well a provider labels exchange wallets.
 Chapter 2What is on-chain cost basis?On-chain cost basis estimates what holders paid by valuing each coin at the price on the day it last moved on the blockchain. Add those values up and divide by the supply, and you get the realized price, the average cost of the whole market. Split by coin age, it gives a separate cost for short-term and long-term holders.
 Chapter 2What is SOPR?SOPR, the spent output profit ratio, compares what coins were worth when spent on-chain with what they were worth when last received. Above 1 means the coins that moved were spent at a profit on average; below 1 means at a loss. Traders watch how SOPR behaves around 1 to see whether holders are taking profits or giving up.
 Chapter 2What is NUPL?NUPL, net unrealized profit and loss, measures how much paper profit or loss all holders of a coin are sitting on, as a share of market cap. It equals market cap minus realized cap, divided by market cap. A positive reading means holders are in profit overall; a negative one means the market trades below its on-chain cost basis.
 Chapter 2What is MVRV, and how do traders read it?MVRV, market value to realized value, divides a coin's market cap by its realized cap, which values each coin at the price when it last moved. A reading of 1.25 means holders are up 25% on average, and below 1 means they are at a loss. Traders use MVRV and its holder-age versions to judge how stretched valuations are.
 Chapter 2What is the MVRV Z-score?The MVRV Z-score measures how far a coin's market cap sits above or below its realized cap, in units of the standard deviation of market cap over its history. The formula is market cap minus realized cap, divided by that standard deviation. High readings mean an unusually stretched market; readings below 0 mean price is under the average on-chain cost.

