How to do fundamental analysis on crypto.
Fundamental analysis on crypto studies what could give a coin lasting demand. Most coins have no earnings, so you look at what the network does, who pays to use it, how its supply will grow, whether the token captures any fees and who controls the project. It helps you judge value and dilution, and it is weak at timing.

Two tokens both trade at $2.00. One has 100 million tokens in circulation and no more to come. The other has 100 million today, with 1 billion planned in total.
At the same price, the second network is valued at ten times the first once every planned token exists, and the price chart does not show it.
Fundamental analysis looks past the chart at what creates or destroys demand for an asset. For a company that means earnings, and most coins have none.
So for crypto you study the network, its users, its supply and the people behind it. The forex lesson on fundamental analysis covers the same idea for currencies.
What can you analyse when a coin has no earnings?
Four questions cover most of the ground:
- What does the network do, and who pays to use it?
- How will the supply change over time?
- Does the token capture any of the value the network creates?
- Who controls the code and the tokens?
Bitcoin is a special case. Its supply is capped at 21 million coins and holders receive no income from it, so analysis centres on demand: who buys it, and why.
The lessons on what Bitcoin is and on the Bitcoin halving, which cuts the flow of new coins, cover that side.
What does the network do, and who uses it?
Start with the job. A network might move payments or run apps. A token with no clear use depends entirely on people wanting to hold it.
Then look for evidence of use. Common measures are daily transactions, active addresses, the value held in its apps and the fees users pay. The lesson on on-chain analysis shows where to read them.
Treat activity counts with care. One person can run thousands of addresses, and bots can fill blocks with cheap transactions. Reward programmes can also pay people to look busy.
Fees are harder to fake in bulk, because each one costs real money. That makes them a useful anchor for a rough value check.
Say, as an illustration, a network's circulating tokens are worth $200 million and users pay $10 million a year in fees. The tokens trade at 20 times annual fees (200 ÷ 10), a figure to set beside similar networks.
A lower multiple can mean the token is cheap. It can also mean the market expects usage to fall, so the number opens the question and the rest of your research has to settle it.
How do supply and tokenomics affect the price?
Tokenomics is the design of a token's supply: how tokens are created, handed out and removed. A few numbers sit at its centre, and token data sites and project documents list them.
Circulating supply is the number of tokens that exist and can trade today. Maximum supply is the most that will ever exist.
Market capitalisation is price × circulating supply. Fully diluted valuation (FDV) is usually price × maximum supply. Some data sites multiply by the total supply created so far instead, and that is the usual basis for a token with no maximum, such as ether.
For the second token in the opening example, with illustrative numbers:
- Market cap: $2.00 × 100 million = $200 million.
- FDV: $2.00 × 1 billion = $2 billion.
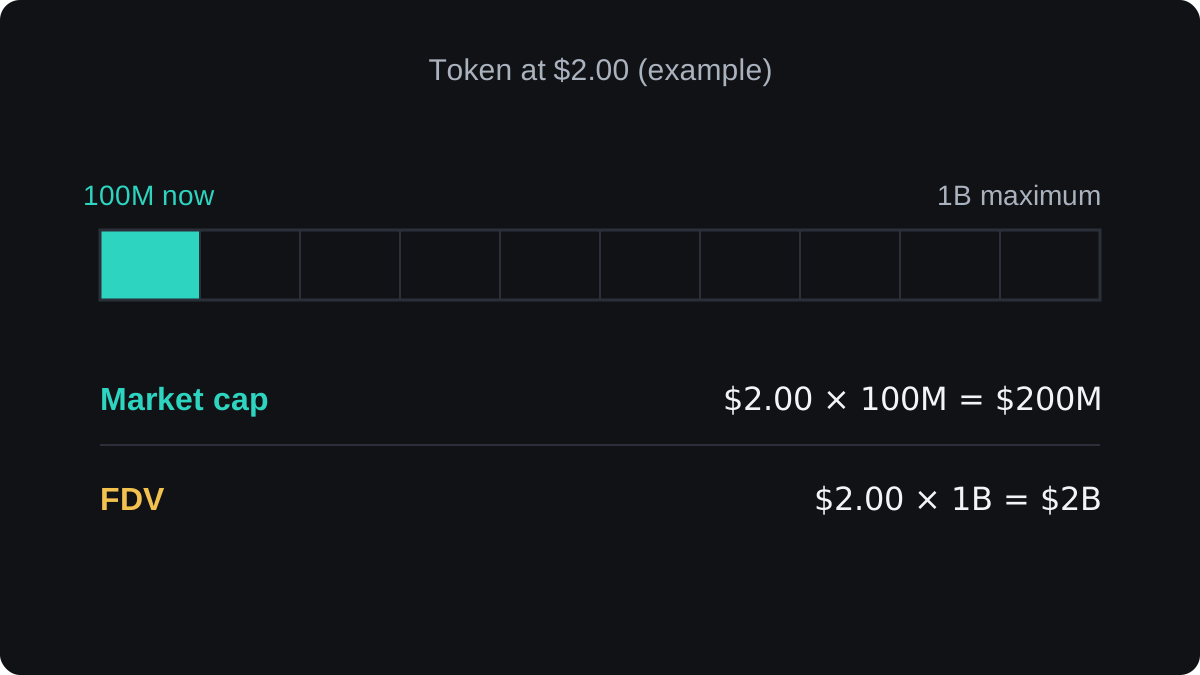
The gap matters because new tokens keep arriving. Tokens held by the team and early investors are often locked at first, then released on a timetable called vesting.
Say 50 million tokens are released next month, so circulating supply rises from 100 million to 150 million.
If buyers still value the network at $200 million, each token is worth $200 million ÷ 150 million = $1.33. That is about a third less than $2.00.
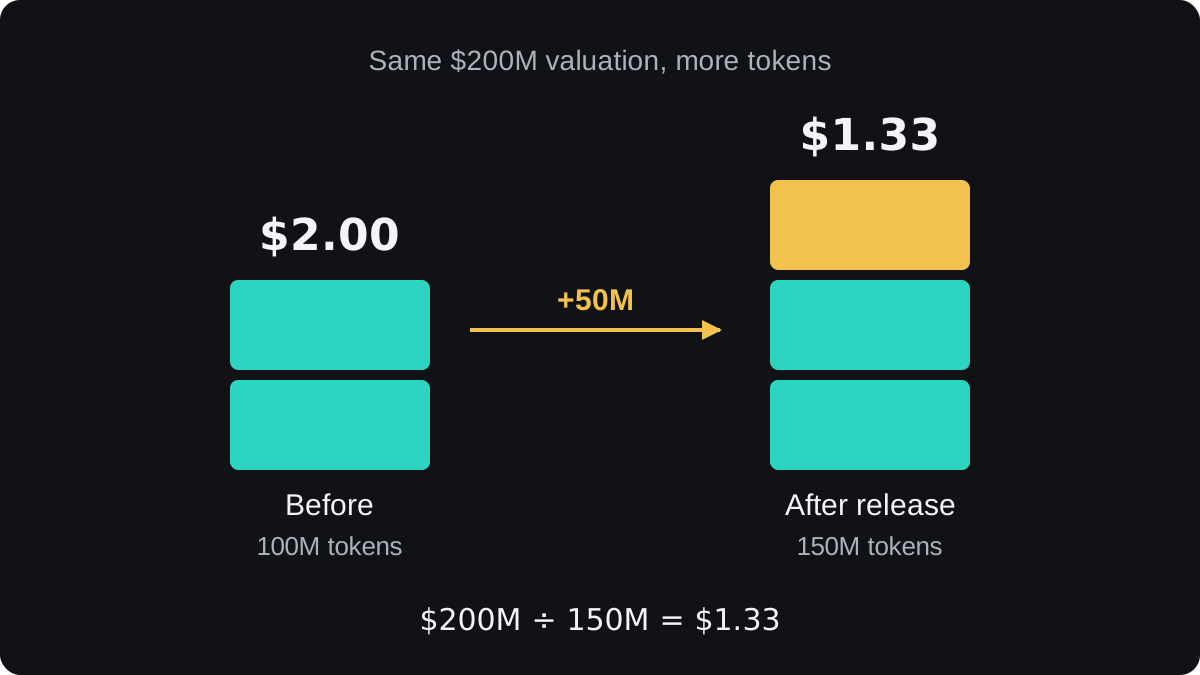
Real markets rarely move that neatly: demand can grow at the same time, and not every released token gets sold. The sum shows the pressure a release can put on price, and projects often publish the release dates in advance.
Some networks also create new tokens all the time, for example as staking rewards, and some destroy part of their fees, which is called burning.
New tokens minus burned ones shows how fast supply is growing. Holders who do not earn the new tokens are diluted by that growth.
Does the token capture any of the value?
A busy network can still have a weak token. Ask what the token is needed for, and where the fees go.
Some tokens must be spent as fees to use the network. That creates demand, but a user who buys the token just before paying and keeps none afterwards adds little lasting demand.
Some networks burn part of those fees or pay them to stakers, which passes value to holders.
A token that only grants votes, on a network whose users pay fees in something else, may gain little from heavy use.
Who controls the project?
Look at who holds the tokens. If a few wallets own most of the supply, one sale can move the price and a handful of votes can decide any proposal.
A block explorer lists the largest holders. Read it with care, because one exchange wallet often holds coins for many customers.
Check who can change the code. Some smart contracts have admin keys that can pause the contract or create new tokens. That power may be needed, and you should know who holds it.
Track record counts too. A project that has run for years without a serious hack has shown something a new one has not. A security audit helps, though audited code has still been hacked.
Where do crypto fundamentals fall short?
Prices can ignore fundamentals for months. Crypto moves with the flow of money and with stories that spread fast, as the lesson on crypto and the economy explains.
Much of the data comes from the projects themselves. A whitepaper is a plan, and a roadmap can slip or change.
Most tokens also lack an accepted valuation model, so two careful analysts can reach opposite answers from the same data.
Fundamentals are slow and charts are fast, so many traders use both. Fundamentals help choose what to trade, and technical analysis helps choose when.
Questions
Does fundamental analysis work for crypto?
It shows what a network does and how its supply behaves, which can steer you away from tokens built to dilute holders. It is weak at timing, because crypto prices can ignore fundamentals for long stretches.
What is the difference between market cap and FDV?
Market cap multiplies the price by the tokens in circulation now. FDV usually multiplies it by the maximum supply, so a wide gap between them means many tokens are still to come.
Where can I find a token's release schedule?
In the project's documentation and on token data sites, which often list upcoming releases. Check more than one source, because schedules can change.
What is tokenomics?
Tokenomics is the design of a token's supply and use: how tokens are created, handed out and removed, and what holders can do with them.
Keep learning
 Chapter 1Technical analysis and price action in crypto.Technical analysis on crypto uses the same tools as on any chart: trend, support and resistance, candles and indicators. Crypto adds quirks. The market never closes, so the daily candle depends on your platform's settings. Each exchange prints its own price, forced selling leaves long wicks, and moves that span years read better on a log scale.
 Chapter 1Does the economy drive crypto prices?Partly. Interest rates, the amount of money in the financial system, investors' appetite for risk and the US dollar all reach crypto prices, often through the same channels that move technology shares. How strong those links are changes over time, and crypto's own events, such as hacks or new products, can outweigh them for months.

