Exchange flows and exchange balances.
Exchange flows track coins moving onto and off known exchange addresses. Inflows arrive, outflows leave, and netflow is inflow minus outflow. Exchange balance is the total held at those addresses, often shown as a share of supply. Rising balances can mean coins ready to sell, but every figure depends on how well a provider labels exchange wallets.
Nội dung này hiện chỉ có bản tiếng Anh.

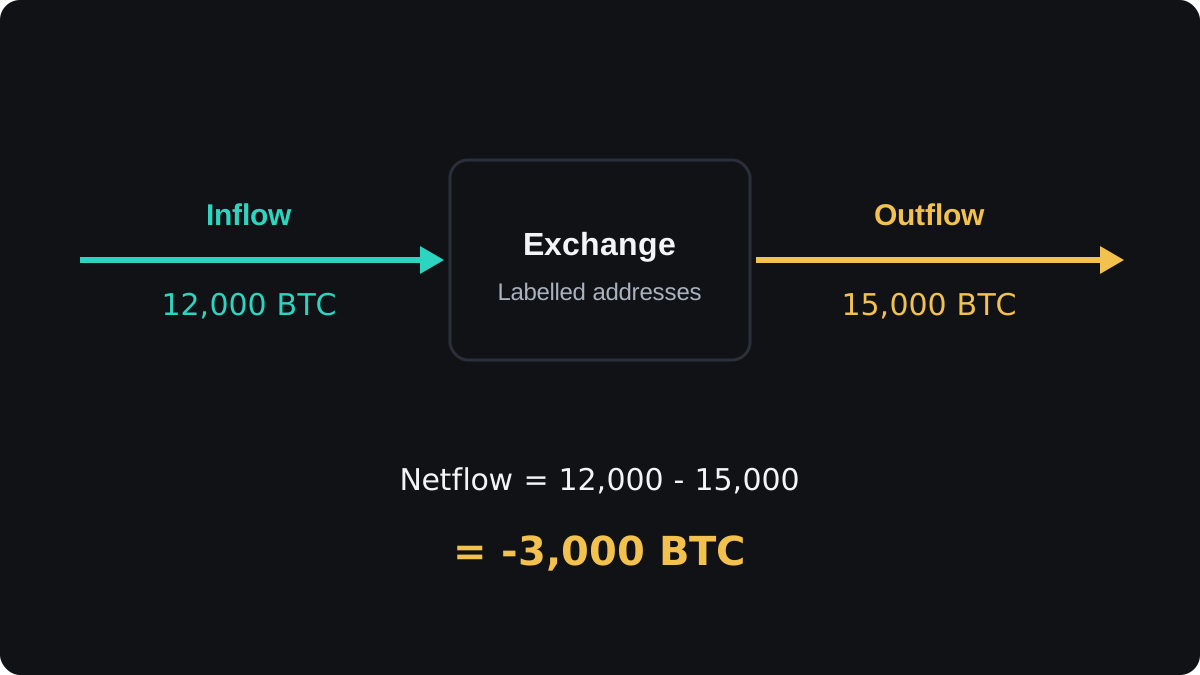
Imagine an illustrative day on which 12,000 BTC arrive at addresses that belong to exchanges, and 15,000 BTC leave them. More coins went out than came in. An on-chain dashboard would report a netflow of -3,000 BTC.
Traders use numbers like that to guess what holders plan to do next, and the guess is easy to get wrong.
Inflows, outflows and netflow
An exchange inflow is the amount of a coin sent to addresses that a data provider has labelled as belonging to an exchange. An exchange outflow is the amount sent from those addresses to anywhere else.
Netflow is inflow minus outflow for the period. In the example, 12,000 minus 15,000 = -3,000 BTC. A negative netflow means exchanges held fewer coins at the end of the day than at the start.
Flows can be counted in coins or in dollars. Dollar figures move with the price even when the number of coins is unchanged, so compare like with like.
Exchange balance and its share of supply
Exchange balance is the total amount held at all known exchange addresses at one moment. Each day's netflow is what changes it from one day to the next.
Many charts show the balance as a percentage of circulating supply. The formula is exchange balance ÷ circulating supply × 100.
Worked example
These numbers are illustrative.
- A coin has 20,000,000 units in circulation, and exchanges hold 2,000,000 of them. That is 2,000,000 ÷ 20,000,000 × 100 = 10% on exchanges.
- Over 30 days, the daily netflows add up to -100,000 units.
- The balance falls to 2,000,000 minus 100,000 = 1,900,000.
- The share is now 1,900,000 ÷ 20,000,000 × 100 = 9.5%.
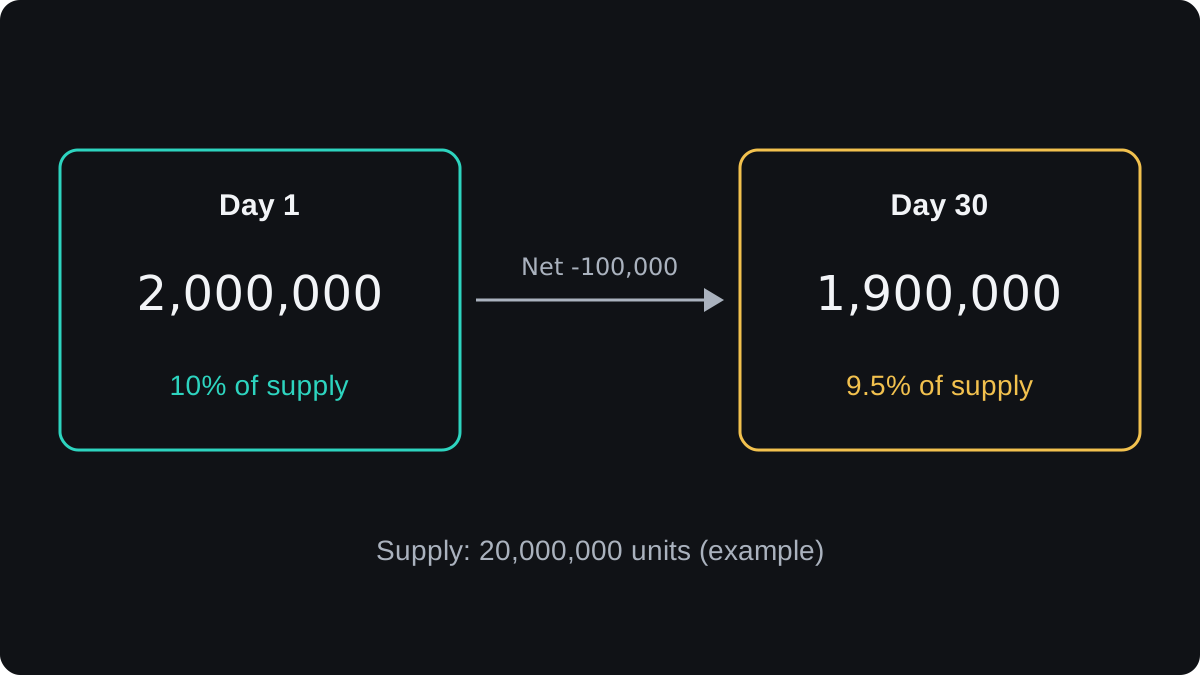
A move from 10% to 9.5% looks small on a chart. It still means 100,000 coins left exchange wallets in a month, which is the kind of change traders watch.
Why traders watch exchange flows
Coins on an exchange can be sold in seconds. Coins in a private wallet need a transfer first.
So a large inflow is often read as supply getting ready to sell, and steady outflows as holders moving coins into self-custody wallets.
Stablecoins are read the other way round. Stablecoins have mostly been used to trade other crypto, so one sent to an exchange is read as money that could buy coins, and rising stablecoin balances on exchanges as buying power waiting on the side.
The type of exchange matters. Coins sent to a derivatives exchange may be collateral for futures, which could be long or short. Coins sent to a spot exchange are more likely to be sold, though nothing forces a sale.
Where exchange flow data misleads
Every flow number depends on labels. Say an exchange moves 50,000 BTC from a labelled cold wallet to a new one.
Until the provider tags the new wallet, the chart shows a 50,000 BTC outflow and a balance 50,000 BTC lower. The exchange still holds every coin.
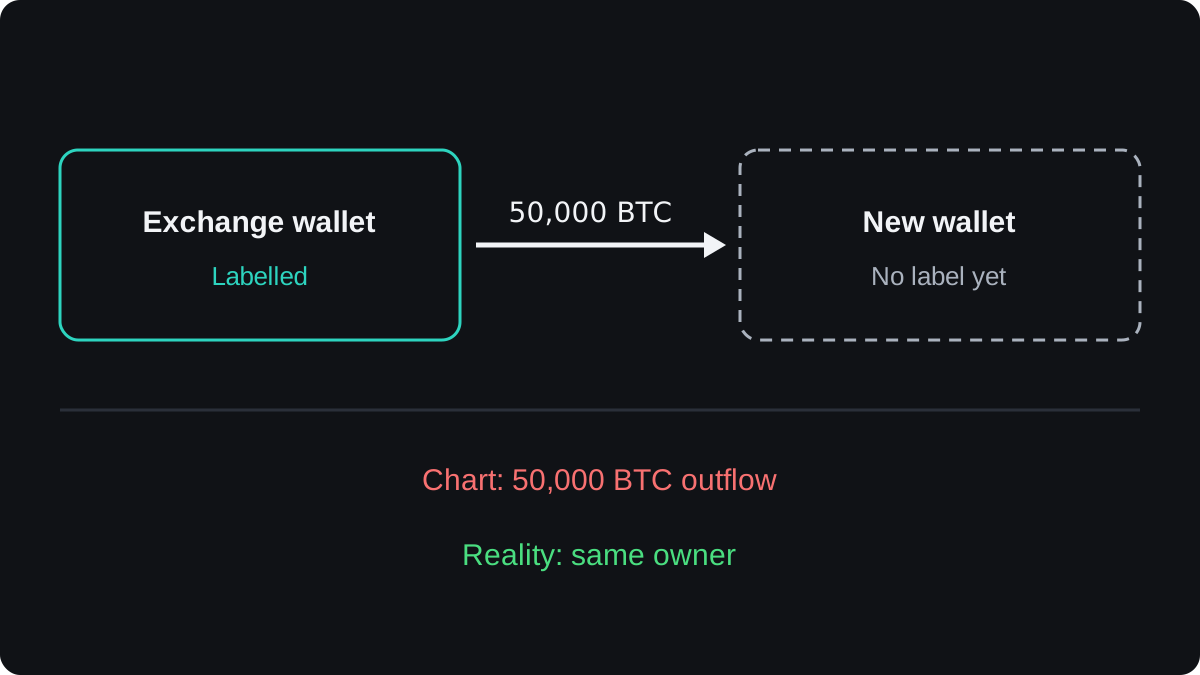
Exchanges also shuffle coins between their own hot and cold wallets all the time. Providers try to remove these internal moves in their own ways, and some count only wallets they are confident about, so their exchange balances differ.
The market's structure has changed over the years. Custodians for ETFs and other funds hold coins too, and whether a provider counts their wallets as exchange wallets changes the balance chart.
When a provider adds or removes a batch of labelled wallets, the balance moves in one step. Providers also revise past data when labels change.
Trades between customers of the same exchange do not move coins on-chain, as the on-chain analysis lesson explains. A large holder can sell a big position to another customer, and the netflow chart shows nothing at all.
Reading flows without overreading them
Treat flows as a description of where coins sit, and look for persistence. One large inflow can be a single customer or a relabelled wallet. Weeks of steady outflows, visible at more than one provider, say more.
Check flows against price and against other data, such as ETF flows and the profit or loss of recent buyers. A falling exchange balance during a falling price tells a different story from one during a rising price.
Exchange data is no timing signal on its own. Inflows can sit on an exchange for weeks before anything is sold, or never be sold. No balance level or flow size has reliably marked a top or a bottom.
Your entries still need their own stop and a position size you can live with.
Câu hỏi thường gặp
Is a falling exchange balance bullish?
It means fewer coins sit in exchange wallets that a provider knows about. That is often read as less supply ready to sell. It can also come from relabelling or from coins moving to custodians.
What is the difference between exchange netflow and exchange balance?
Netflow is the change over a period, inflow minus outflow. Balance is the total held at one moment. Adding up every day's netflow gives the change in balance.
Why do two websites show different exchange balances?
They label different sets of addresses as exchange wallets and remove internal transfers in different ways. Compare the trend within one provider before you compare levels between providers.
Do exchange inflows always lead to selling?
No. Coins can be sent to an exchange as collateral, to move them to another network, or simply to sit there. Inflows raise the chance of selling and nothing more.
Học tiếp
 Chương 2What is on-chain analysis?On-chain analysis is the study of a blockchain's public records, such as transfers, balances and the age of coins, to see how holders behave. Data providers turn raw transactions into metrics like exchange flows and realized price. It adds context about supply and holder profit, but it cannot tell you when to trade.
 Chương 2Spot volume and volume delta.Spot volume is the amount of a coin traded for immediate delivery over a period. Volume delta splits that volume by who started each trade: volume from market buy orders minus volume from market sell orders. A positive delta means buyers were the more aggressive side, which is different from saying there were more buyers.
 Chương 2What is on-chain cost basis?On-chain cost basis estimates what holders paid by valuing each coin at the price on the day it last moved on the blockchain. Add those values up and divide by the supply, and you get the realized price, the average cost of the whole market. Split by coin age, it gives a separate cost for short-term and long-term holders.
 Chương 2What is SOPR?SOPR, the spent output profit ratio, compares what coins were worth when spent on-chain with what they were worth when last received. Above 1 means the coins that moved were spent at a profit on average; below 1 means at a loss. Traders watch how SOPR behaves around 1 to see whether holders are taking profits or giving up.
 Chương 2What is NUPL?NUPL, net unrealized profit and loss, measures how much paper profit or loss all holders of a coin are sitting on, as a share of market cap. It equals market cap minus realized cap, divided by market cap. A positive reading means holders are in profit overall; a negative one means the market trades below its on-chain cost basis.
 Chương 2What is MVRV, and how do traders read it?MVRV, market value to realized value, divides a coin's market cap by its realized cap, which values each coin at the price when it last moved. A reading of 1.25 means holders are up 25% on average, and below 1 means they are at a loss. Traders use MVRV and its holder-age versions to judge how stretched valuations are.
 Chương 2What is the MVRV Z-score?The MVRV Z-score measures how far a coin's market cap sits above or below its realized cap, in units of the standard deviation of market cap over its history. The formula is market cap minus realized cap, divided by that standard deviation. High readings mean an unusually stretched market; readings below 0 mean price is under the average on-chain cost.

