How to backtest a strategy.
Backtesting means applying fixed entry and exit rules to past price data, one candle at a time, and recording every trade the rules would have taken, including costs. The result shows how the rules behaved in the past, with their win rate and worst drawdown. It cannot prove future profits, and errors like look-ahead bias inflate it.
이 내용은 현재 영어로만 제공됩니다.
Before you put money behind a set of rules, you can ask a cheaper question: what would these rules have done on prices that already happened? Working that out honestly, trade by trade, is a backtest.
A backtest cannot see the future. What it can show early is that an idea lost money in the past, or that its losing runs were longer than you could sit through.
What do you need before you start?
You need rules so exact that two people testing them on the same chart would record the same trades. The entry and exit rules lesson covers how to write them.
This lesson uses one example system. It illustrates the method and is not a recommendation:
- Market: EUR/USD on the daily chart, in a US dollar account.
- Entry: when a candle closes above the 50-day simple moving average and the candle before it closed below, buy at the open of the next candle.
- Exit: a stop loss 30 pips below entry and a take profit 60 pips above.
- Size: 0.10 lot, with one trade open at a time.
Words like "strong trend" or "clean bounce" have no place in a testable rule. Replace them with something you can measure, or hindsight will quietly pick your trades for you.
You also need price history that covers rising, falling and sideways stretches. Choose the period before you see any results, so it cannot be bent to suit them.
How do you run a backtest step by step?
You can test by hand on a chart or with code, for example an Expert Advisor in MetaTrader's Strategy Tester. Code is faster and repeats exactly. Testing by hand is slower, and you see every setup with your own eyes.
The steps are the same either way:
- Go to the start of your chosen period and hide everything to the right of the current candle, by scrolling or with a bar replay mode.
- On each closed candle, check the entry rule. If it is met, write down the date, the entry price at the next candle's open, the stop and the target.
- Move forward one candle at a time until the stop or the target is hit, then record the exit and the result in pips.
- Subtract costs from every trade: the spread, any commission, swap for nights held and an allowance for slippage.
- Repeat until the end of the period without changing a single rule.
Daily candles hide the order of events inside a day. If one candle touches both your stop and your target, you cannot tell which came first, so count it as a loss or check a lower timeframe.
How do you read the results of a backtest?
Suppose the example rules took 40 trades over the test period, with 16 reaching the target and 24 hitting the stop. These numbers are illustrative, chosen to show the arithmetic.
On 0.10 lot of EUR/USD in a US dollar account, one pip is worth $1, as the pip value calculator confirms. Assume an illustrative spread of 1.0 pip, so each round trip costs $1.
To keep the sums simple, this example counts only the spread. A real test would also add commission if your account charges it, and swap for each night a trade stays open.
- Wins: 16 × 60 pips × $1 = $960.
- Losses: 24 × 30 pips × $1 = $720.
- Result before costs: $960 − $720 = $240.
- Costs: 40 trades × $1 = $40.
- Result after costs: $240 − $40 = $200.
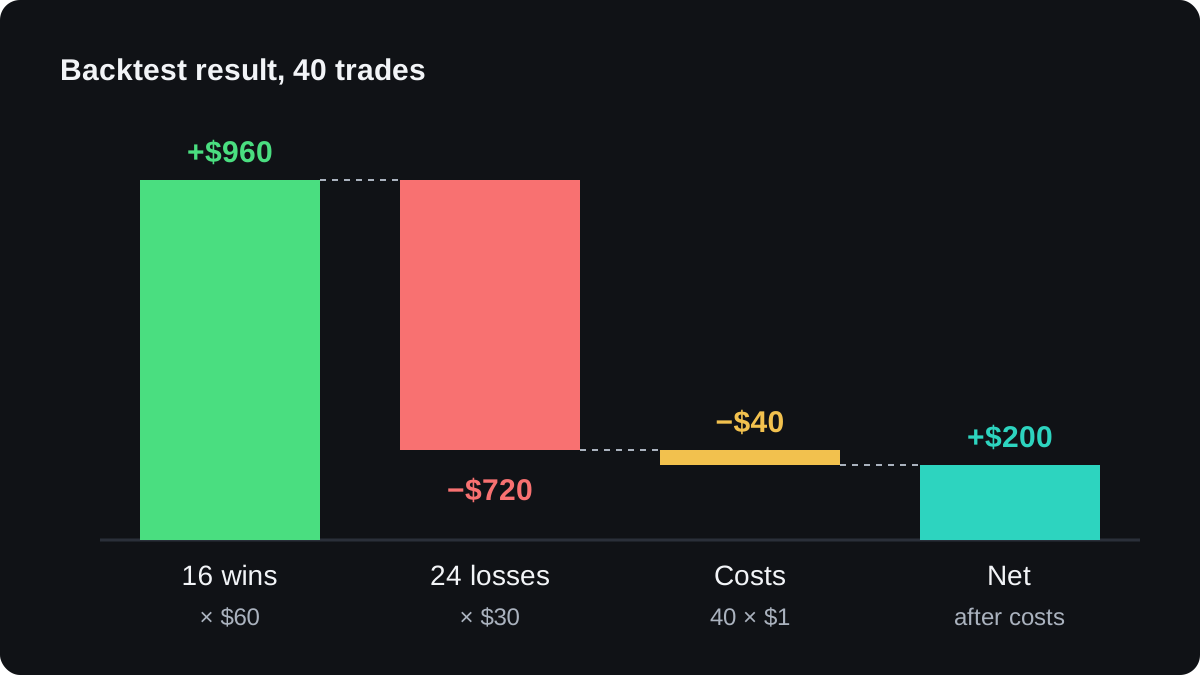
After its $1 cost, each win nets $59 and each loss costs $31. Three measures summarise the log.
Expectancy is the average result per trade. Profit factor is the total won divided by the total lost. A drawdown is a fall in the account from a previous high, covered in the drawdown lesson.
Suppose the deepest drawdown in this log came from six losses in a row.
| Measure | How it is worked out | Result |
|---|---|---|
| Win rate | 16 ÷ 40 | 40% |
| Net result | $960 − $720 − $40 | $200 |
| Expectancy | $200 ÷ 40 | $5.00 per trade |
| Profit factor | $944 ÷ $744 | 1.27 |
| Breakeven win rate | $31 ÷ ($59 + $31) | 34.4% |
| Deepest drawdown | 6 × $31 | $186 |
The breakeven win rate is the share of winners at which the rules make nothing. At 40% against 34.4%, this test clears it by 5.6 percentage points.
That margin is thin for 40 trades. A standard error measures how far a percentage could move by chance, and a rough range for the true win rate is the result plus or minus two of them.
Here that is √(0.40 × 0.60 ÷ 40) ≈ 0.077, so the range runs from roughly 25% to 55%.
The bottom of that range sits below breakeven, so this sample cannot rule out a system with no edge at all. Testing four times as many trades would halve the width of that range.
Mistakes that make a backtest look better than it is
Each error below pushes results upward, which is why they are easy to miss: a test that looks good rarely gets checked as hard as one that looks bad.
Look-ahead bias
Look-ahead bias means using information the rules could not have had at the moment of the decision. Entering at a candle's open because of how that same candle closed is the classic case.
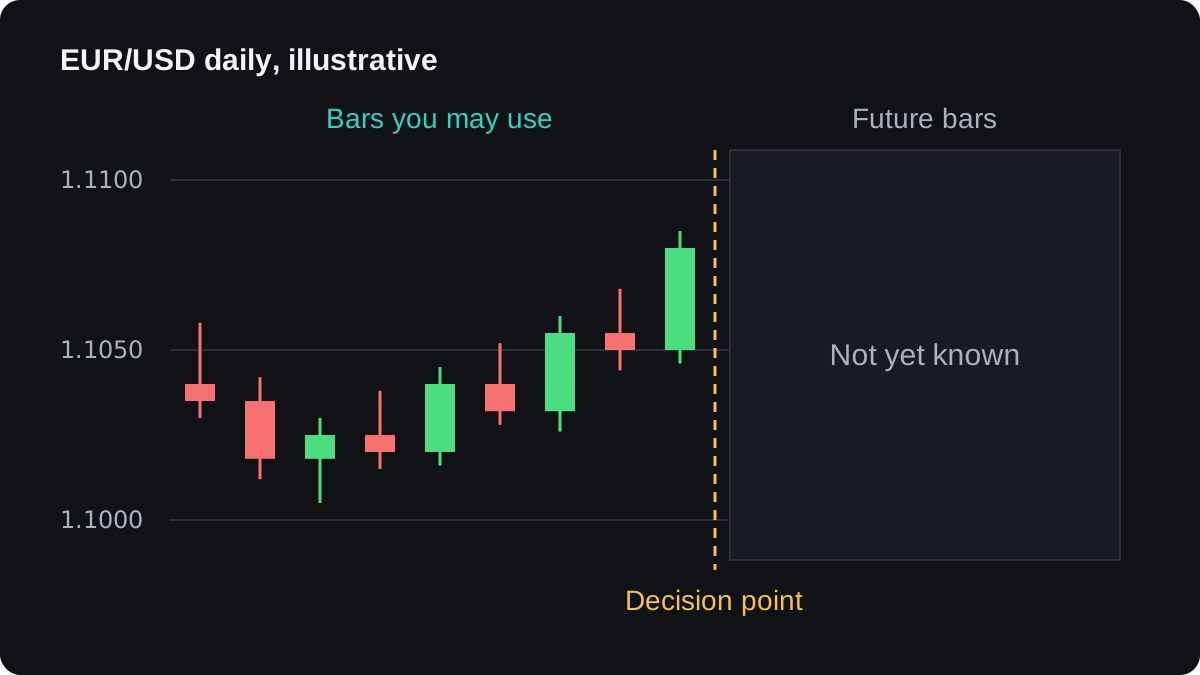
It also creeps in through indicators that redraw past values, such as many zigzag tools, and through levels you drew using candles that sit to their right on the chart.
Leaving out costs
In the worked example, costs took $40 of the $240, one sixth of the result. A system with a 10 pip target pays the same 1 pip spread on a much smaller win, so costs eat a tenth of every winner.
Add commission, swap and slippage as well. The cost of one trade lesson shows how to total them per round trip.
Overfitting
Overfitting is tuning settings until they match the past too closely. Try every moving average from 40 to 60 days with stops from 20 to 40 pips, and some combination is likely to look excellent by luck alone.
The defence is to split your history before you start. Build and adjust the rules on the older part, for example the first 70%, called the in-sample data. Then run them once on the newer 30%, the out-of-sample data.
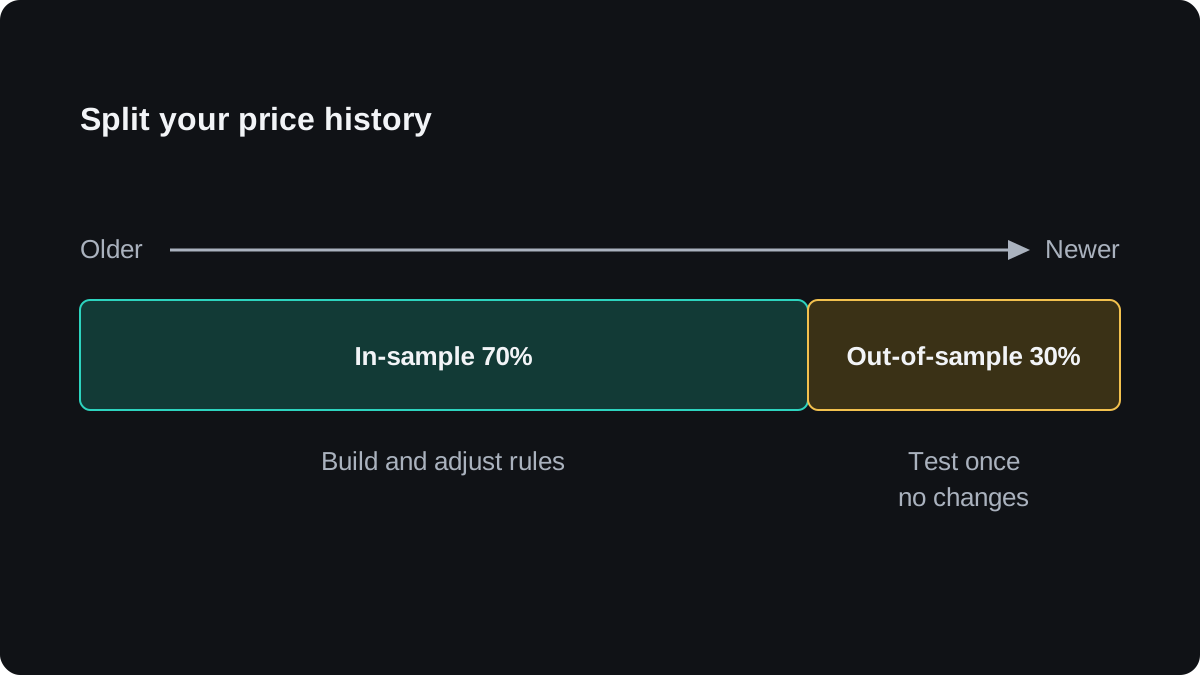
If the out-of-sample run falls apart, the in-sample result was probably fitted to noise. Going back to adjust the rules after seeing it turns that section into in-sample data too.
Cherry-picking
Starting the test just after a bad stretch, skipping trades that felt wrong or changing a rule halfway makes the log flattering and useless. If you change a rule, restart the test from the beginning.
What a good backtest does and does not tell you
Suppose your rules still show a profit after costs, on out-of-sample data and over enough trades. That tells you they had an edge in the past, on that data. Markets change, so it says nothing certain about next year.
The next check is a forward test on a demo account, where the rules meet prices nobody has seen yet, along with live spreads and your own reactions.
Keep the backtest log. Comparing later trades with it shows whether the rules are behaving as they did in the test or drifting away from those results.
자주 묻는 질문
How many trades does a backtest need?
There is no fixed number, but more trades give a narrower range. With 40 trades and a 40% win rate, the true win rate could plausibly sit anywhere from about 25% to 55%, and four times as many trades halves that range.
Can you backtest without coding?
Yes. Scroll or replay a chart one candle at a time, apply your rules on each closed candle and record every trade in a spreadsheet, including costs.
What is the difference between backtesting and forward testing?
A backtest runs your rules on past prices. A forward test runs them on new prices as they arrive, usually on a demo account, which also tests whether you follow the rules in real time.
Does a profitable backtest mean a strategy will make money?
No. It shows the rules had an edge on that past data, and errors such as look-ahead bias, overfitting or missing costs can make even that untrue.
Should a backtest include the spread?
Yes, along with commission, swap and an allowance for slippage. In this lesson's example, a 1.0 pip spread cut the result from $240 to $200.
이어서 배우기
 챕터 3What is a trading system?A trading system is a written set of rules that decides which market you trade, when you enter, when you exit and how much you risk on each trade. Following the same rules every time makes your decisions consistent and lets you measure results, though no system wins every trade or guarantees a profit.
 챕터 3Building your entry and exit rules.Entry and exit rules are precise when two people reading them would take the same trade at the same price. Each rule names a timeframe, a price type, a number and an order type. A complete set covers the filter, trigger, entry, stop, target, position size and a time limit, plus what to do in awkward cases.
 챕터 3Forward testing on a demo account.Forward testing means running a trading system on live prices as they arrive, usually on a demo account, before you risk real money. It checks whether backtest results survive real spreads, slippage, missed signals and your own discipline. Use the same rules, account size and lot sizing you plan to use live, and record every trade.

