Combining Fibonacci with support and resistance.
Combining Fibonacci with support and resistance means checking whether a retracement level sits on a price the market has reacted to before, such as an old high. When the two line up within a few pips, traders call it a confluence zone and watch it more closely. Price can still break straight through a zone.
이 내용은 현재 영어로만 제공됩니다.
Draw a Fibonacci retracement on almost any swing and you get four or five lines. A pullback will nearly always end near one of them, so a single level on its own tells you little.
A retracement level becomes more interesting when it sits on a price the market has already reacted to. If the tools are new to you, start with Fibonacci retracement levels and how to draw them.
What does confluence mean on a Fibonacci chart?
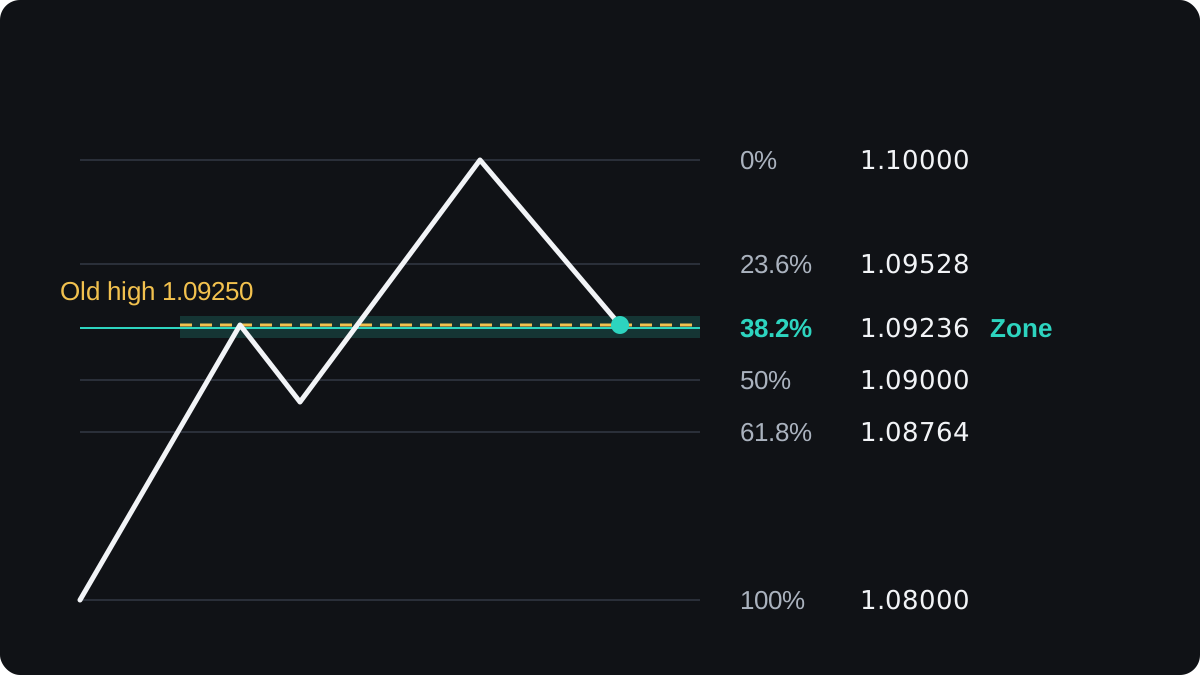
Suppose EUR/USD climbs from 1.08000 to 1.10000. On the way up it stalled at 1.09250, fell back, then broke through. Now it is falling again, and the 38.2% retracement of the whole move is at 1.09236.
Two separate tools now point at nearly the same price. The Fibonacci tool got there by arithmetic on the swing. The old level got there because buyers and sellers actually traded around it.
When two or more independent methods mark the same area, traders call it confluence. The area itself is a confluence zone, measured from the lower of the two prices to the higher.
The old high was resistance on the way up. Once price broke above it, the same price may act as support on the way back down, an idea covered in when support becomes resistance.
How do you find a confluence zone step by step?
Mark the old levels before you touch the Fibonacci tool. If you draw the Fibonacci lines first, it is easy to find an old level that happens to fit.
- Mark horizontal support and resistance from earlier price action: highs and lows where price clearly turned, ideally more than once.
- Pick the swing, from the last clear low to the last clear high in an uptrend.
- Draw the retracement from the start of the swing to its end.
- Write down the price of each Fibonacci level.
- Compare each price with your marked levels, using a tolerance you chose in advance.
Here is the EUR/USD example worked out, with round illustrative prices. The swing runs from 1.08000 to 1.10000, so its size is 0.02000, which is 200 pips.
In an uptrend, each level is the swing high minus the swing size times the ratio:
| Level | Swing × ratio | Price |
|---|---|---|
| 23.6% | 0.02000 × 0.236 = 0.00472 | 1.09528 |
| 38.2% | 0.02000 × 0.382 = 0.00764 | 1.09236 |
| 50% | 0.02000 × 0.500 = 0.01000 | 1.09000 |
| 61.8% | 0.02000 × 0.618 = 0.01236 | 1.08764 |
The old resistance at 1.09250 sits 0.00014 above the 38.2% level, a gap of 1.4 pips. The confluence zone runs from 1.09236 to 1.09250.
The Fibonacci calculator does these subtractions for any swing, so you only need to supply the high and the low.
Why can an overlap matter more than one level?
An old level carries a record of real trades. Some traders who sold at 1.09250 and watched price run higher may buy back near their entry to get out flat, which adds buying at that price.
The Fibonacci level brings a different group: people who watch the ratios, whatever their reasons. When both groups look at the same price, more orders may sit there than at either level alone.
Keep the evidence in proportion. No solid research shows that Fibonacci ratios have special power in markets, and much of their effect may come from people watching them. Confluence makes a zone worth watching without making a turn likely by any measured amount.
How close is close enough?
With four Fibonacci levels and plenty of old highs and lows, something almost always lines up if you allow enough slack. Choosing a tolerance in advance, and checking how much ground it covers, stops the search from becoming wishful.
Try a loose rule first: 5% of the swing. On a 200 pip swing that is 10 pips, so an old level counts as a match within 10 pips of a Fibonacci level. Neither this rule nor any other is an industry standard.
The 61.8% and 23.6% levels, 1.08764 and 1.09528, are 76.4 pips apart. Inside that area, the 10 pip bands cover 1.08764 to 1.08864, 1.08900 to 1.09100, 1.09136 to 1.09336 and 1.09428 to 1.09528.
Those stretches are 10, 20, 20 and 10 pips long, so 60 of the 76.4 pips sit within 10 pips of some Fibonacci level.
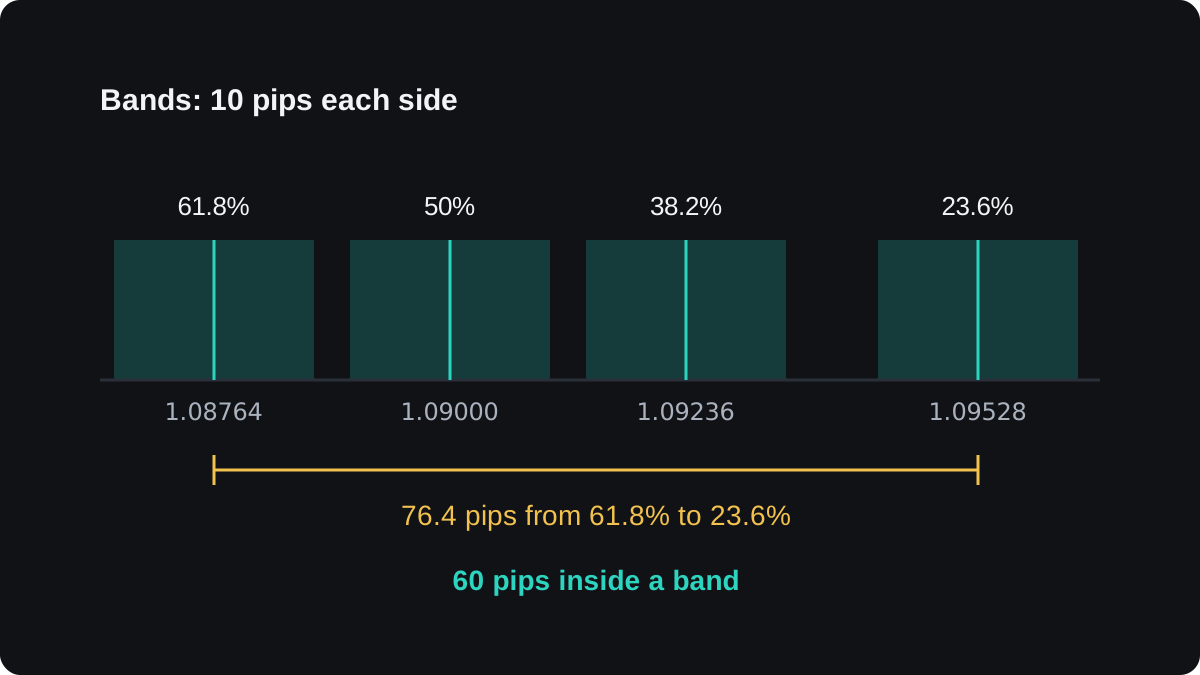
Almost any old level in the pullback area would pass that test, so a match within 10 pips says little.
Tighten the rule to 1% of the swing, 2 pips here, and the bands cover 2 + 4 + 4 + 2 = 12 pips, about 16% of the area.
The 1.4 pip gap at 1.09250 passes even that tighter test. The quality of the old level counts as much as the distance: a level with several clear turns tells you more than a single wick.
The support and resistance zones lesson explains why old levels have width of their own.
The same check in a downtrend on USD/JPY
In a downtrend you draw from the swing high to the swing low, and the levels sit above the low. On yen pairs a pip is 0.01.
Say USD/JPY falls from 152.000 to 148.000, a swing of 4.000, or 400 pips. On the way down it found support at 150.50 twice before breaking lower. Each level is the low plus the swing times the ratio:
- 23.6%: 148.000 + 0.944 = 148.944
- 38.2%: 148.000 + 1.528 = 149.528
- 50%: 148.000 + 2.000 = 150.000
- 61.8%: 148.000 + 2.472 = 150.472
The old support at 150.50 is 0.028 above the 61.8% level, a gap of 2.8 pips. With the 1% rule the tolerance here is 4 pips, so the match passes.
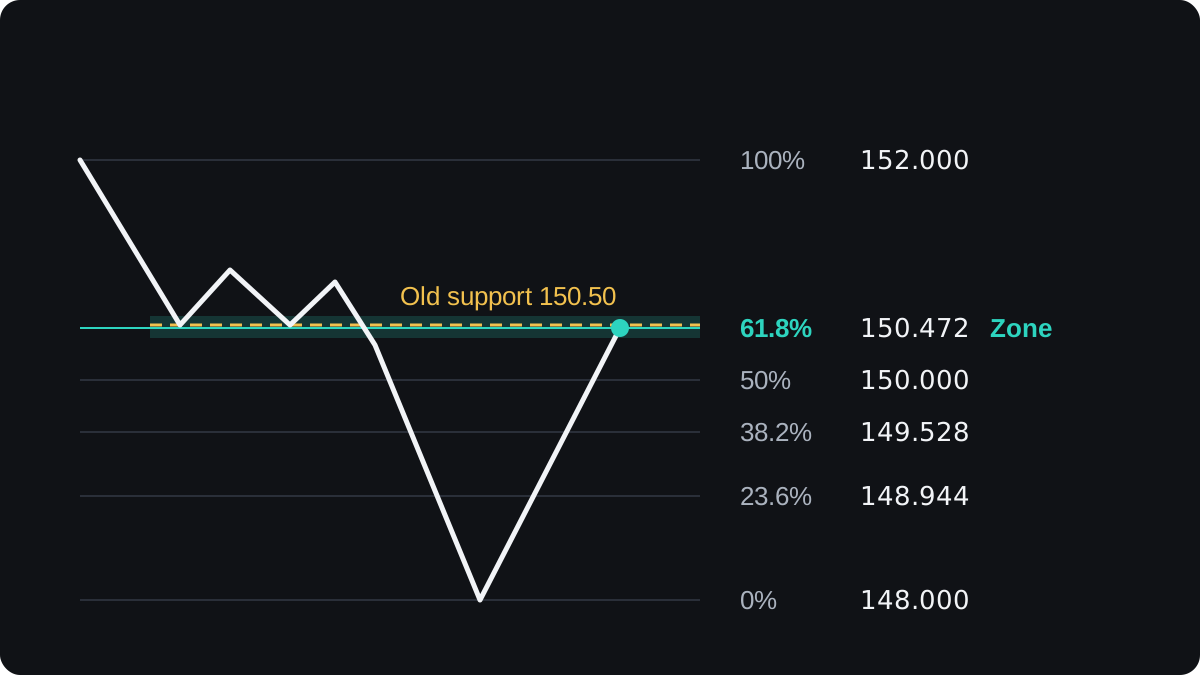
If price rallies into the zone from 150.472 to 150.500, the old support may now act as resistance. The arithmetic is the same as in the uptrend, with the levels counted up from the low.
Turning a zone into a trade plan
A zone marks where to pay attention. Price can still break through it, so any plan needs an exit for that case.
Here is one illustrative plan on the EUR/USD zone, counting price only, with no spread or commission. It shows the arithmetic and is an example, not a recommendation.
- Buy limit at 1.09250, the top of the zone.
- Stop loss at 1.09100, below the zone: 1.09250 minus 1.09100 = 0.00150, which is 15 pips.
- Target at the swing high: 1.10000 minus 1.09250 = 0.00750, which is 75 pips.
- On 0.10 lot of EUR/USD a pip is worth 10,000 × 0.0001 = $1, so the risk is 15 × $1 = $15 and the target is 75 × $1 = $75.
- That is a risk-reward of 1 to 5.
A ratio of 1 to 5 sounds generous, and it has a cost. The old high at 1.10000 is resistance of its own, and a target far from entry is usually reached less often than a near one.
The risk-reward ratio lesson shows how win rate and ratio trade off.
If price falls to 1.09100, the zone has failed and the stop closes the trade. Placing stops with Fibonacci levels covers stop choices in detail, and the next lesson adds trend lines as a third check.
자주 묻는 질문
What is Fibonacci confluence?
It is an area where a Fibonacci retracement level lines up with another, independent level, such as old support or resistance. Traders watch it more closely than a Fibonacci level on its own.
Which Fibonacci level is best with support and resistance?
No ratio has been shown to be reliably better than the others. How close the old level sits and how clearly price reacted to it before matter more than which ratio it matches.
How many pips apart can the two levels be?
There is no fixed rule. Set a tolerance before you look and check how much of the pullback area it covers: on a 200 pip swing, 10 pips covered most of it and 2 pips covered about 16%.
Should I draw Fibonacci or support and resistance first?
Mark support and resistance first. If you draw the Fibonacci lines first, it is easy to pick an old level only because it fits.
Does confluence mean price will reverse?
No. A confluence zone is a place to watch and plan around, and price can break straight through it, so decide your exit before you trade.
이어서 배우기
 챕터 3What are Fibonacci retracement levels?Fibonacci retracement levels are lines drawn at fixed percentages of a price move to mark how deep a pullback has gone. The usual levels are 23.6%, 38.2%, 50%, 61.8% and 78.6%. The middle three get the most attention, but the evidence that price turns at them more than anywhere else is weak.
 챕터 3How to draw Fibonacci retracements.In an uptrend, draw a Fibonacci retracement from the swing low to the swing high, so the levels sit below the high. In a downtrend, draw from the swing high to the swing low, so the levels sit above the low. Use the clear extremes of one completed move, wick to wick.
 챕터 3Combining Fibonacci with trend lines.A Fibonacci retracement offers several levels where a pullback might stop. A trend line through earlier swing lows, or swing highs in a downtrend, narrows the choice: watch the level the line crosses around the time price returns to it. That meeting point is a zone of interest, and price can still break through it.
 챕터 3Combining Fibonacci with candlestick patterns.Combining Fibonacci with candlesticks means waiting for a reversal candle, such as a hammer or an engulfing pattern, to close at a retracement level before you enter. The level shows where a pullback might stop, and the candle shows buyers or sellers stepping in. The cost is a later entry, and the signal still fails often.
 챕터 3Fibonacci extensions for profit targets.A Fibonacci extension projects how far a trend might run after a pullback. You measure the first swing, multiply it by ratios such as 61.8%, 100% and 161.8%, and add each result to the low of the pullback. Traders use the levels as possible take-profit targets, with no guarantee that price reaches them.
 챕터 3Placing stops with Fibonacci levels.A Fibonacci stop goes beyond the next retracement level past your entry, plus a small buffer for the spread and noise. Buy at 50% and the stop sits under 61.8%; sell at 50% and it sits above 61.8%. Then cut the lot size so the wider stop still risks only the money you planned.
 챕터 3Fibonacci cheat sheet.Fibonacci retracement levels are 23.6%, 38.2%, 50%, 61.8% and 78.6% of the last swing, drawn from swing low to swing high in an uptrend. Extensions such as 127.2% and 161.8% project targets. A single level is weak evidence, so look for confluence, and stops usually sit beyond the level or the swing.

