Using the dollar index in your trading.
The US dollar index measures the dollar against a basket of six currencies, so it helps you tell whether a move in a USD pair is broad dollar strength or comes from the other currency. A rising index pushes EUR/USD down and USD/JPY up. It describes the dollar's move at the same moment and does not forecast it.

Say you plan to sell AUD/USD because you expect the Australian dollar to weaken. Before you trade, it helps to know whether the US dollar is also rising against everything else. If it is, your trade depends on two forces at once.
The US dollar index, often shown as DXY, gives you that broad reading in one number. You can use it as a quick check before a USD trade, as long as you know where the check stops being useful.
Which way does a stronger dollar push each pair?
When the dollar index rises, one dollar buys more of the basket currencies on average. What that does to your chart depends on where USD sits in the pair.
When USD is the quote currency, the second name, a stronger dollar makes the pair fall. EUR/USD, GBP/USD and AUD/USD drop when the dollar gains on those currencies.
When USD is the base currency, the first name, a stronger dollar makes the pair rise. USD/JPY, USD/CAD and USD/CHF climb.
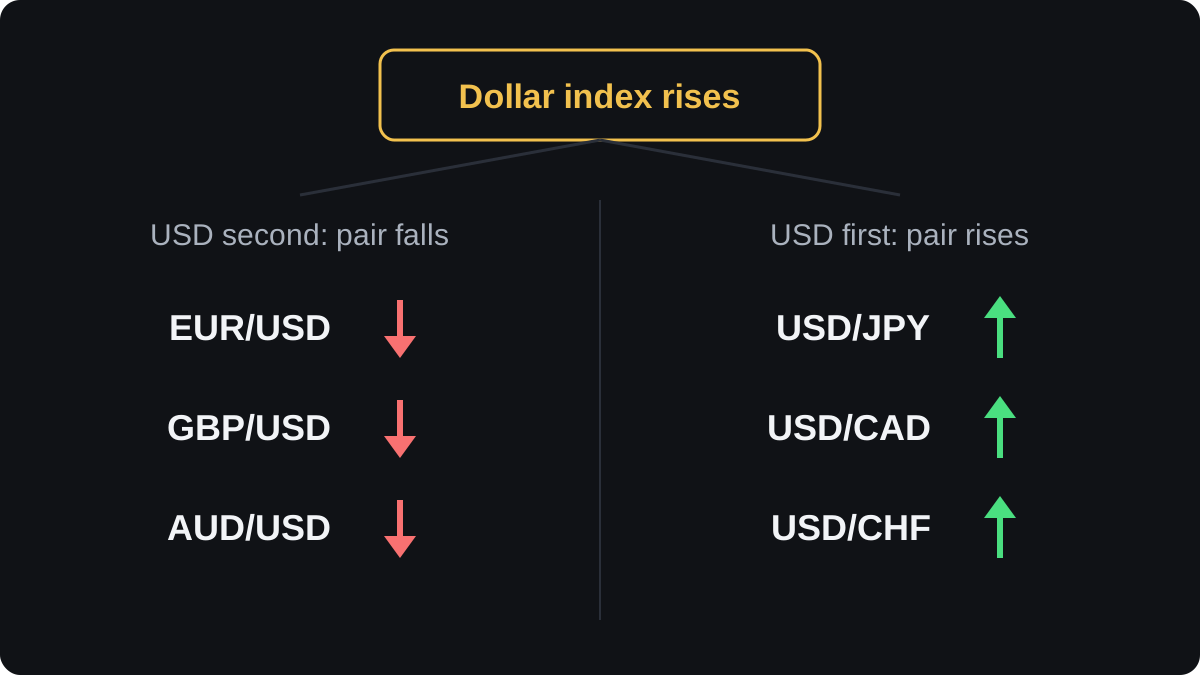
A rising index is downward pressure on one group of charts and upward pressure on the other. When you scan several charts quickly, mixing up the two groups is an easy mistake.
Is the move about the dollar or the other currency?
Every pair has two sides. A falling AUD/USD can mean the US dollar is strong, the Australian dollar is weak, or both. The index helps you split the two, roughly.
The method is to compare percentage changes over the same period. Here is one illustrative day, with round numbers chosen to keep the arithmetic easy:
| Instrument | Open | Close | Pips | Change |
|---|---|---|---|---|
| Dollar index | 100.00 | 101.00 | n/a | +1.00% |
| EUR/USD | 1.10000 | 1.08900 | -110 | -1.00% |
| USD/JPY | 150.00 | 150.30 | +30 | +0.20% |
| AUD/USD | 0.66000 | 0.64680 | -132 | -2.00% |
- Dollar index: (101.00 - 100.00) ÷ 100.00 = +1.00%.
- EUR/USD fell by 0.01100, which is 110 pips. Then 0.01100 ÷ 1.10000 = 1.00%.
- USD/JPY rose by 0.30, which is 30 pips on a yen pair. Then 0.30 ÷ 150.00 = 0.20%.
- AUD/USD fell by 0.01320, which is 132 pips. Then 0.01320 ÷ 0.66000 = 2.00%.
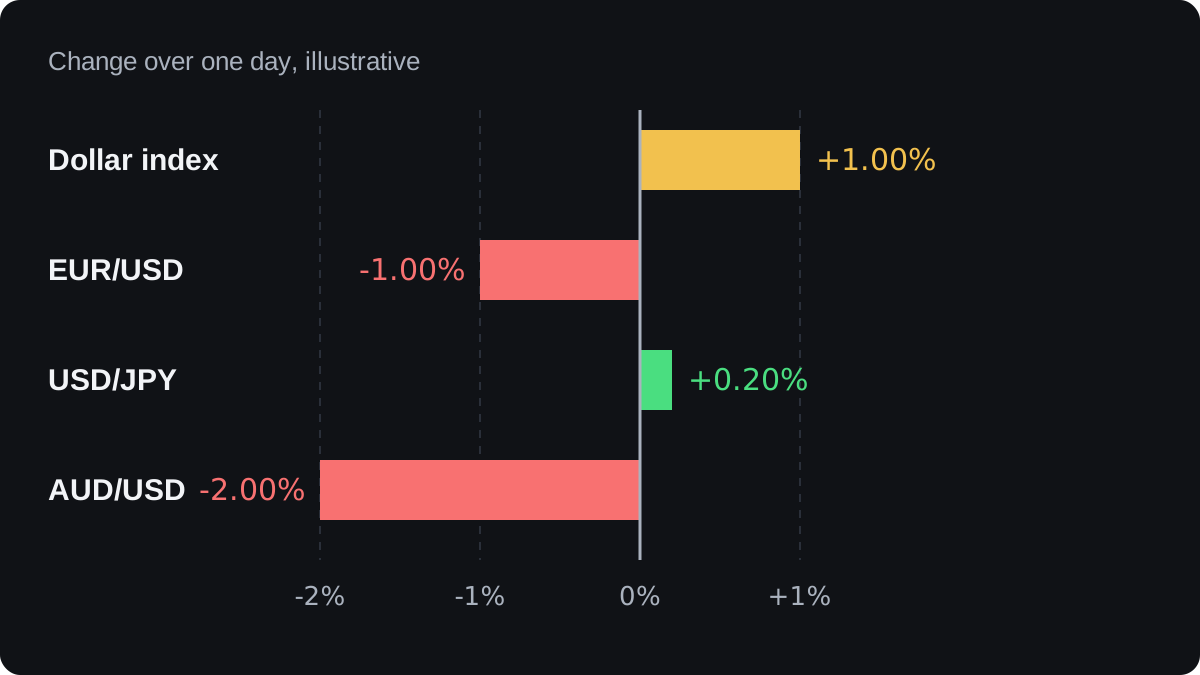
EUR/USD moved in line with the index, which is what you would expect. USD/JPY rose only 0.20% on a day of broad dollar strength, so the yen held up better than the basket.
AUD/USD fell twice as far as the index rose. About half of that move looks like dollar strength, and the rest looks like Australian dollar weakness.
Treat this split as a rough guide. The Australian dollar is outside the index, so no exact formula applies. The comparison tells you where to look for the reason: news from the United States, or news from Australia.
The reason matters for your trade. If you sold AUD/USD on an Australian view and the move came mostly from the dollar, a turn in the dollar could undo your gain while your Australian view stays correct.
Why the index and EUR/USD look like mirror images
The index is a weighted average, and the euro carries about 57.6% of the weight. The yen has about 13.6%, the pound 11.9%, the Canadian dollar 9.1%, the Swedish krona 4.2% and the Swiss franc 3.6%.
With that much euro inside it, the index and EUR/USD usually move in opposite directions, often by similar amounts. Checking the index before a EUR/USD trade mostly repeats what the EUR/USD chart already shows.
The index adds more for pairs where the other currency has a small weight or none. The Australian and New Zealand dollars are outside the basket, so for AUD/USD and NZD/USD the index gives a fairly separate reading of the dollar side.
Are two of your trades the same dollar bet?
The index is also a way to check your open positions. Say you sell 0.10 lot of EUR/USD at 1.10000 and buy 0.10 lot of USD/JPY at 150.00. They look like two ideas on two pairs.
Both trades gain when the dollar rises, so together they behave like one larger long dollar position. On 0.10 lot, a EUR/USD pip is 10,000 × 0.0001 = $1, and a USD/JPY pip is 10,000 × 0.01 = ¥100.
Suppose each pair moves 1% in the dollar's favour:
- EUR/USD falls to 1.08900, a gain of 110 pips, so 110 × $1 = +$110.00.
- USD/JPY rises to 151.50, a gain of 150 pips, so 150 × ¥100 = +¥15,000.
- Converted at 151.50, that is 15,000 ÷ 151.50 = +$99.01.
- Together: $110.00 + $99.01 = +$209.01.
Now suppose each pair moves 1% against the dollar instead:
- EUR/USD rises to 1.11100, a loss of 110 pips, or -$110.00.
- USD/JPY falls to 148.50, a loss of 150 pips, or -¥15,000.
- Converted at 148.50, that is 15,000 ÷ 148.50 = -$101.01.
- Together: -$110.00 - $101.01 = -$211.01.
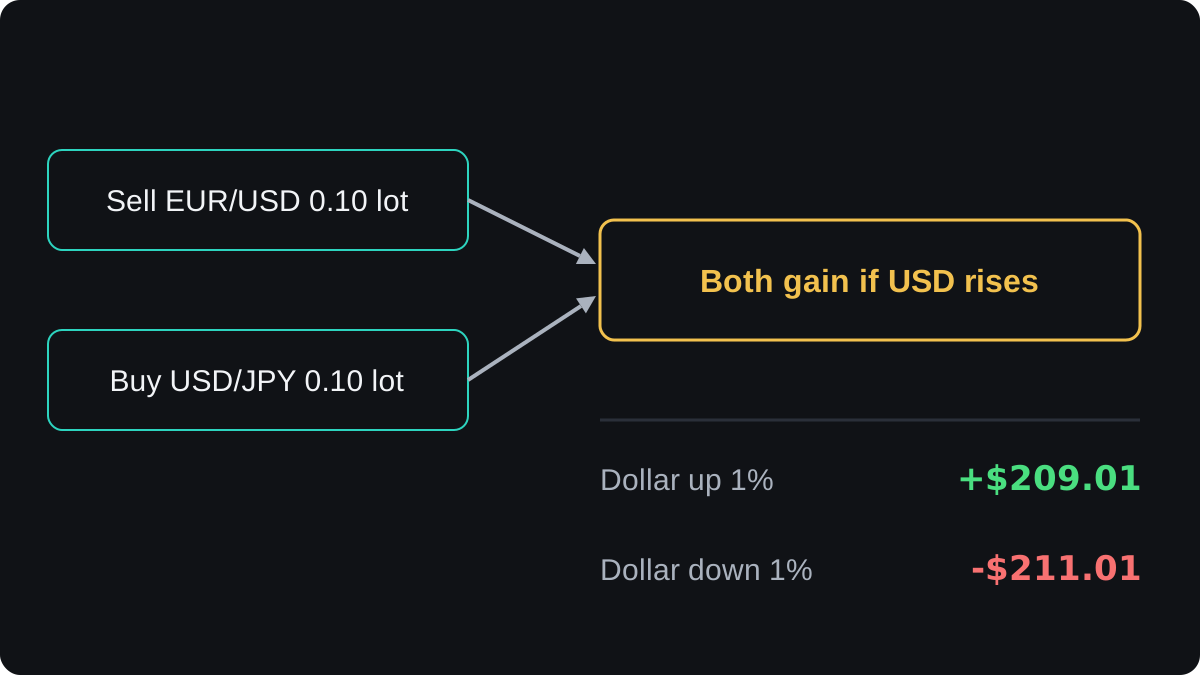
The dollar figures depend on the conversion rate, so treat them as illustrative. The pip value calculator does the conversion for other sizes and prices.
Before adding a USD trade, ask whether it bets on the dollar in the same direction as trades you already hold. The lesson on correlation and portfolio risk goes further.
A dollar check in four steps
You can run this in a minute before any USD trade:
- Note which side of the pair USD sits on, so you know what a rising index does to your chart.
- Compare the index's change with the pair's change over the same period, on the timeframe you trade.
- Decide whether the move is mostly dollar or mostly the other currency, and whether that matches your reason for the trade.
- Check your open positions for the same dollar direction.
A dollar that is rising this week can still be falling today. The lesson on multiple timeframes explains how to handle that.
Where the dollar index falls short
The basket has stayed the same since the euro replaced several European currencies in it. It leaves out large trading partners of the United States, such as China and Mexico.
For a wider measure, the Federal Reserve publishes trade-weighted dollar indexes that cover many more currencies. They suit a big-picture view better than a quick check.
The index is calculated from exchange rates, so it moves at the same moment as its pairs. It cannot know anything its component prices do not.
For that reason, be cautious with claims that signals on the index chart predict moves in the pairs.
Relationships also shift. When one currency has its own strong story, such as a central bank surprise, its pair with the dollar can move against the index for days.
Not every broker offers a dollar index instrument, and a broker's version can differ from the futures price. Many charting platforms show the index anyway, which is enough for a check.
Bond yields are one force behind the index, and the next lesson covers them.
Questions
Does a rising dollar index mean I should buy USD/JPY?
No. It shows which way broad pressure on the dollar has been running. The yen can still move on its own news, so use the index as a check on your own trade idea.
Why does the dollar index move opposite to EUR/USD?
The euro makes up about 57.6% of the index. When the euro gains on the dollar, EUR/USD rises and the index usually falls.
Does the dollar index include the Australian dollar?
No. The basket holds the euro, yen, pound, Canadian dollar, Swedish krona and Swiss franc, so AUD and NZD are outside it.
Can you trade the dollar index directly?
US dollar index futures trade on an exchange, and some brokers offer a CFD on the index. Read the contract specification first, because size, hours and pricing vary.
Which timeframe should I use for the dollar index?
Use the same timeframe as the pair you plan to trade. Comparing a daily index chart with a five-minute pair chart mixes two different questions.