What goes into a trading plan?
A trading plan is a set of written rules you decide before you trade. It covers your goals, the markets and hours you trade, the exact setups that let you enter, your exits, your risk limits per trade, day and week, and the daily routine and review that keep you following it.

A trading plan is a short document you write while you are calm, so you are not inventing rules while a trade moves against you. The previous lesson covered why that helps. This one covers what to put in it.
There is no official template. The parts below cover the decisions every trade forces on you, and together they fit on one or two pages.
What are the parts of a trading plan?
Every trade asks you the same questions. What are you trying to achieve, where and when do you trade, and what makes you enter?
When do you get out, and how much can you lose? How will you check afterwards that you followed the rules?
A plan answers each question in advance, which gives it six parts.
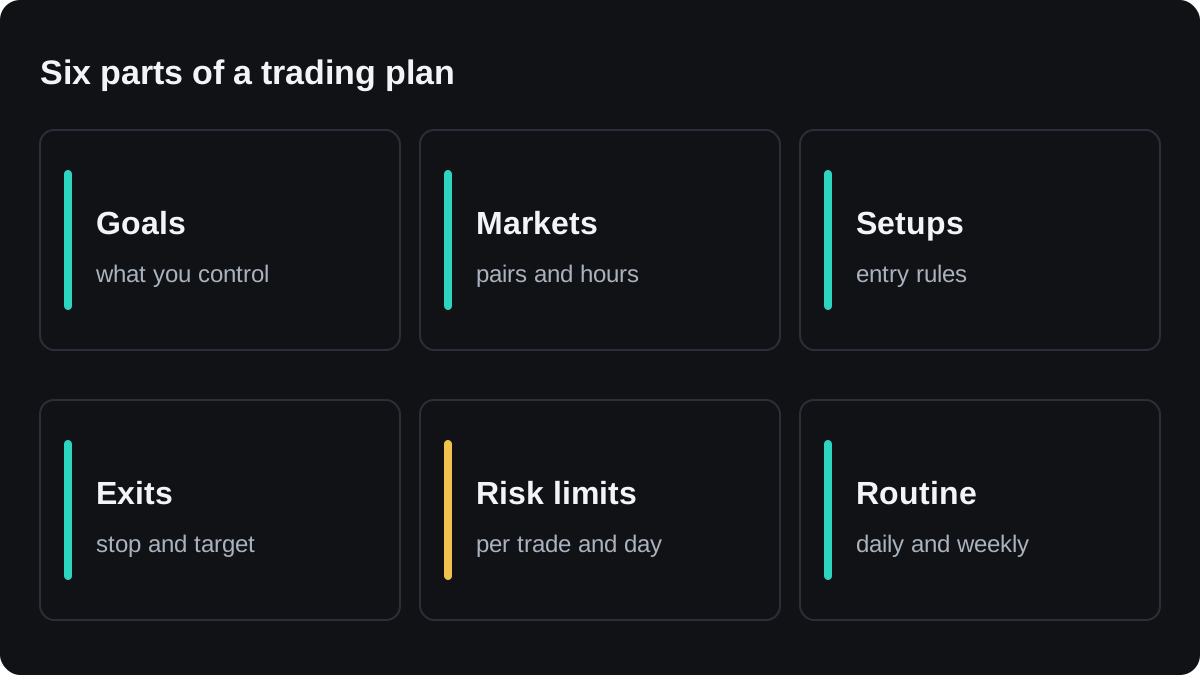
Write each part as a rule you can check with a yes or no. "Be careful around news" cannot be checked. "No new trades within 15 minutes of a high-impact release" can, and it is the example rule used below.
How do you set goals you can control?
A goal such as "make 10% a month" depends on what the market does, and you cannot control that. It can also push you to trade bigger after a bad week to catch up.
A process goal depends only on your own actions. For example: risk no more than 1% on each of the next 40 trades, and log every one of them.
Add a learning goal with a time limit. For example: trade the plan on a demo account for three months before using real money, and change rules only at a scheduled review.
Finish this part with the money involved. Write down how much capital you have set aside for trading, and confirm that losing all of it would not touch your rent or savings.
How do you write market, setup and exit rules?
Markets and hours
Pick a short list of instruments, such as EUR/USD and USD/JPY. With only a few, you learn how each one usually moves and what it costs to trade.
Then write the hours you will trade, tied to the forex trading sessions, and the chart timeframes you will use. Both follow from your trading style and the time you really have.
Someone at a desk job all day cannot follow a plan built around watching 5-minute charts during working hours.
Setups
A setup is the exact chart condition that lets you enter. Write it so another person could look at your chart and agree whether it was there.
The setup below was written for this lesson to show the format. It is not a recommendation, and it has not been tested here.
- Market: EUR/USD on the 1-hour chart, during the London session.
- Condition: the 50-period moving average slopes upward.
- Entry: price pulls back to the average and a candle closes back above it. Buy at the open of the next candle.
- Stop loss: 5 pips below the low of the pullback.
- Target: twice the distance from entry to stop.
- Filter: no new trades within 15 minutes of a high-impact release.
Writing a setup down does not show that it makes money. You find out by backtesting it on past charts and then running it on a demo, and a setup with good past results can still fail when market conditions change.
Exits
Exit rules sit next to the entry. State where the stop and target go, whether you ever move the stop, and whether you close trades before the weekend.
A rule against widening a stop after entry keeps each loss at the size you planned. The next part turns that size into money.
How do you write your risk limits?
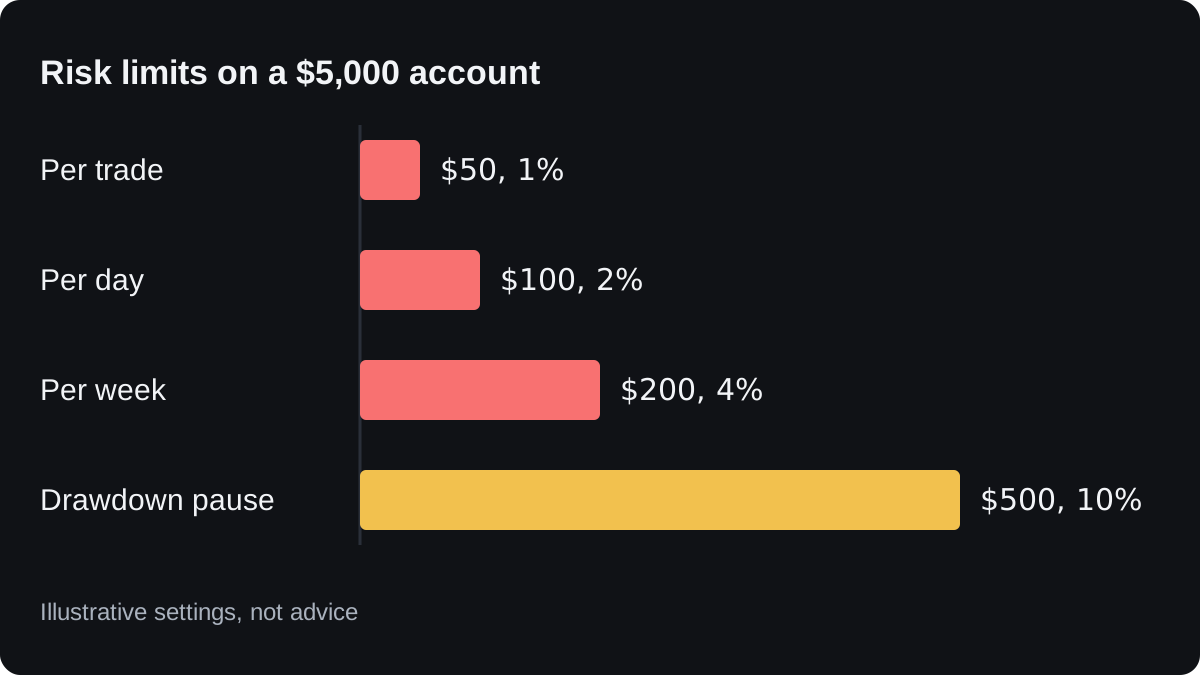
Risk limits convert percentages into money before you trade. The settings below use an illustrative $5,000 account. They show the method and are not a suggestion for your own account.
| Rule | Setting | On $5,000 |
|---|---|---|
| Risk per trade | 1% of starting balance | $50 |
| Daily loss limit | 2% | $100 |
| Weekly loss limit | 4% | $200 |
| Open trades at once | 2 at most | $100 at risk |
| Drawdown pause | 10% below peak | $500 |
The daily limit equals two full losses of $50, so two stopped trades end the day. The weekly limit equals four. With at most two trades open, the most you can lose at one moment is also $100.
This example keeps the risk at a fixed $50. If you work out 1% from your current balance instead, each loss gets slightly smaller after a losing run.
The drawdown pause is a fall from your highest balance that stops live trading. From a $5,000 peak, a balance of $4,500 means you go back to a demo until your next review.
From the limit to a lot size
The per-trade limit fixes the money, and your setup fixes the stop distance in pips. The position size joins the two. Here is a trade on EUR/USD with a 25 pip stop:
- Risk allowed: 1% of $5,000 = $50.
- One standard lot of EUR/USD is worth $10 a pip, so 25 pips risk 25 × $10 = $250 per lot.
- Size: $50 ÷ $250 = 0.20 lot.
- Check: 0.20 lot is worth $2 a pip, and 25 × $2 = $50.
A yen pair adds a conversion. Take USD/JPY at an illustrative 150.00, with a 40 pip stop:
- One lot is worth 0.01 × 100,000 = 1,000 yen a pip, so 40 pips risk 40,000 yen per lot.
- In dollars that is 40,000 ÷ 150.00 = $266.67 per lot.
- Size: $50 ÷ $266.67 = 0.1875 lot. If your platform trades in steps of 0.01 lot, round down to 0.18.
- Check: 0.18 × $266.67 = $48.00, inside the limit.
Round down every time, so the loss stays at or under the limit. These sums leave out commission and slippage, which can make a stopped trade cost slightly more. The lot size calculator repeats the arithmetic for any pair.
What routine keeps the plan in use?
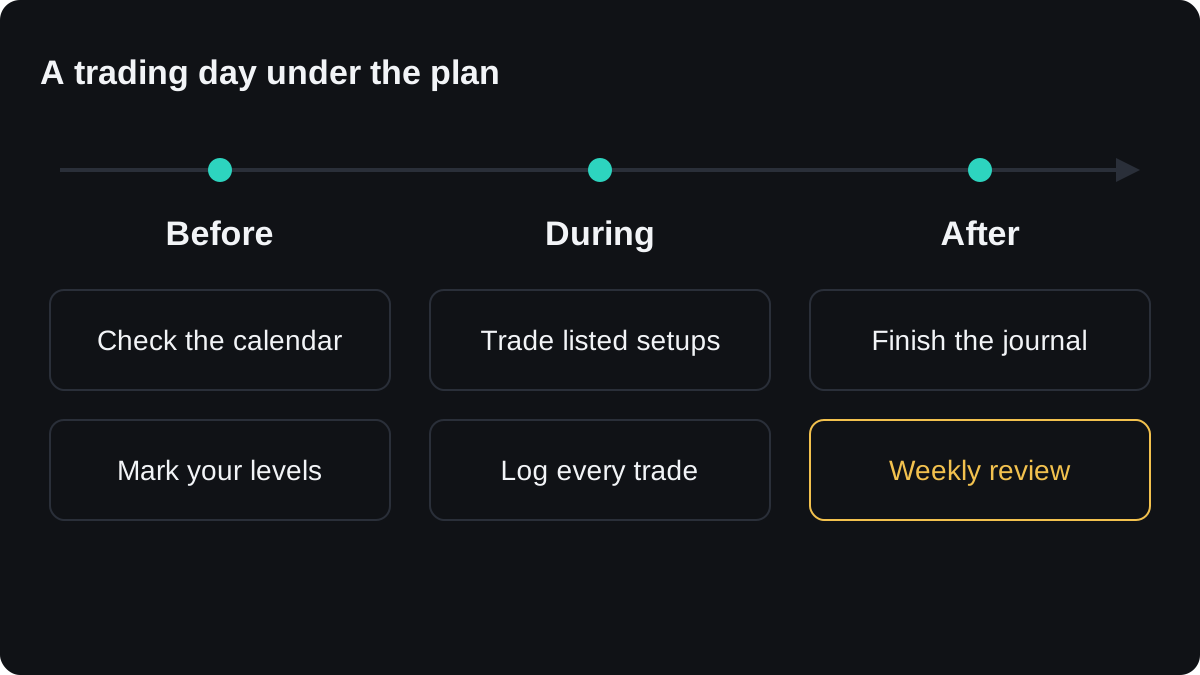
A plan read once is soon forgotten. The routine part says what you do each day and each week, so every rule comes up at the moment it applies.
Before the session, check the economic calendar for releases on your pairs and mark the levels your setups use. During it, take only the setups on your list and log each trade as you place it.
After the session, finish your journal. The journal lesson lists fields worth recording, such as the setup, the planned and actual risk, and whether every rule was followed.
Once a week, read the journal against the plan. Change a rule only at that review, never while a trade is open, and write the date and reason beside the change.
The next lesson, sticking to your plan, covers how to keep to these rules after a run of losses.
Questions
How long should a trading plan be?
Long enough to answer each part with a rule you can check, which usually fits on one or two pages. A longer plan is harder to reread before each session.
Should a trading plan include a profit target?
You can note what you hope to earn, but a monthly money target can push you to take extra risk after losses. Process goals, such as following your risk rule on every trade, are the ones you control.
What percentage should I risk per trade?
No single figure suits everyone. This lesson used 1% only to show the arithmetic. At a fixed $50 per trade, ten losses in a row cost $500, which in this example triggers the drawdown pause.
Can I change my trading plan?
Yes, at a scheduled review, with the date and the reason written down. A rule changed in the middle of a trade is usually a decision made under pressure.
Do I need a trading plan for a demo account?
Yes. A demo is where you check whether you can follow the rules and how the setup behaves, and that only works when the rules are written down.
Keep learning
 Chapter 1Why you need a trading plan.A trading plan is a written set of rules for what you trade, how much you risk and when you exit, decided before you open a position. It protects you from impulsive trades made under pressure, such as chasing a move or moving a stop, by capping what any single trade or day can cost.
 Chapter 1Sticking to your plan.Sticking to your plan means following rules you wrote before the trade, even when a trade goes wrong. A short pre-trade checklist, a fixed risk per trade, stops you never widen and a daily loss limit turn the plan into habits. A journal then shows where you broke a rule and what it cost.

