How to build a crypto trading strategy.
To build a crypto trading strategy, choose one market, instrument and timeframe, then pick one idea you can explain, such as following trends. Write exact rules for the filter, entry, stop, target and size, so every number comes from the rules. Test them on past prices with fees included, then forward test before risking real money.
Here is a complete strategy, written as two rules:
- Buy ETH/USD when a 4-hour candle closes above the highest high of the previous 20 candles, while the last daily close is above its 50-day moving average.
- Risk 1% of the account, with a stop 4% below the entry and a target twice as far above it.
Nobody knows yet whether it makes money. What it already has is rules that anyone can check on a chart, and that is where every strategy starts.
The general method is in the lesson on what a trading system is. This lesson covers what changes for crypto and builds the example above step by step.
Choose the market, instrument and timeframe
Start with one or two large coins that trade in high volume on your venue. Their order books are deeper, so spreads are narrower and fills are closer to the prices you see on the chart.
Decide whether you trade the coin itself or a CFD on it. Coins you buy outright only profit from a rise. A CFD lets you sell short, but holding it overnight usually costs a swap.
Then pick a timeframe that fits your day. Crypto never closes, so a 4-hour chart prints six candles every day, weekends included. Decide in advance which signals you will act on and which you will skip because you are asleep.
Crypto has no official daily close. Some exchange charts start the day at midnight UTC and others at another hour, while a broker's platform uses its own server time.
Check the setting before you write rules about daily candles. The lesson on choosing timeframes covers the trade-offs.
Pick one idea you can explain
Every set of rules needs a reason it might work. Two common ideas are trend following and range trading.
Trend following buys after a strong rise and sells after a strong fall, on the view that big moves often continue. It tends to lose many small trades in sideways markets and earn from the occasional long run.
Range trading buys near the bottom of a sideways range and sells near the top. It can win often while the range holds and loses when price breaks out of it.
Choose the idea that suits how you think, and expect long stretches when it does badly. The lesson on trending and ranging markets shows how to tell the two apart. The example strategy follows trends.
Write rules that leave nothing to guess
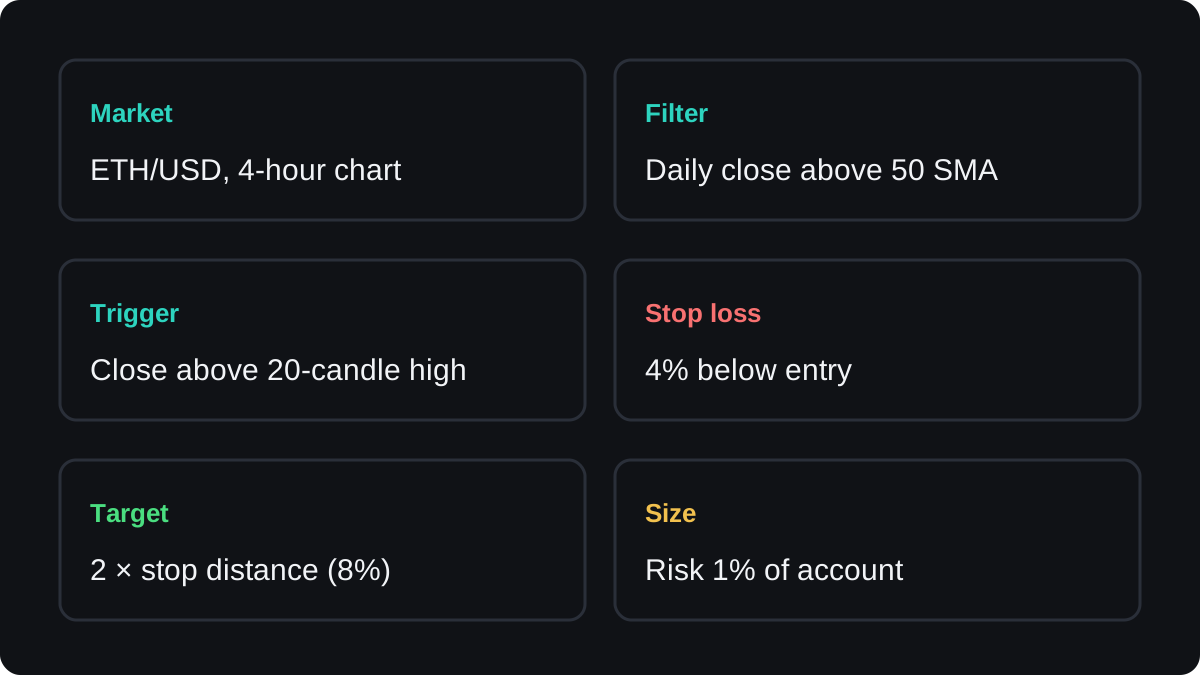
Each rule should be a yes or no question that two people would answer the same way. The example strategy, written out in full:
- Market: ETH/USD on the 4-hour chart.
- Filter: trade only while the last daily candle closed above its 50-day simple moving average.
- Trigger: buy when a 4-hour candle closes above the highest high of the previous 20 candles.
- Stop loss: 4% below the entry price.
- Target: twice the stop distance above the entry, so 8%.
- Size: risk 1% of the account on each trade.
Add the cases where you stay out. Here: one position at a time, and no entry while the spread is wider than 0.2% of the price.
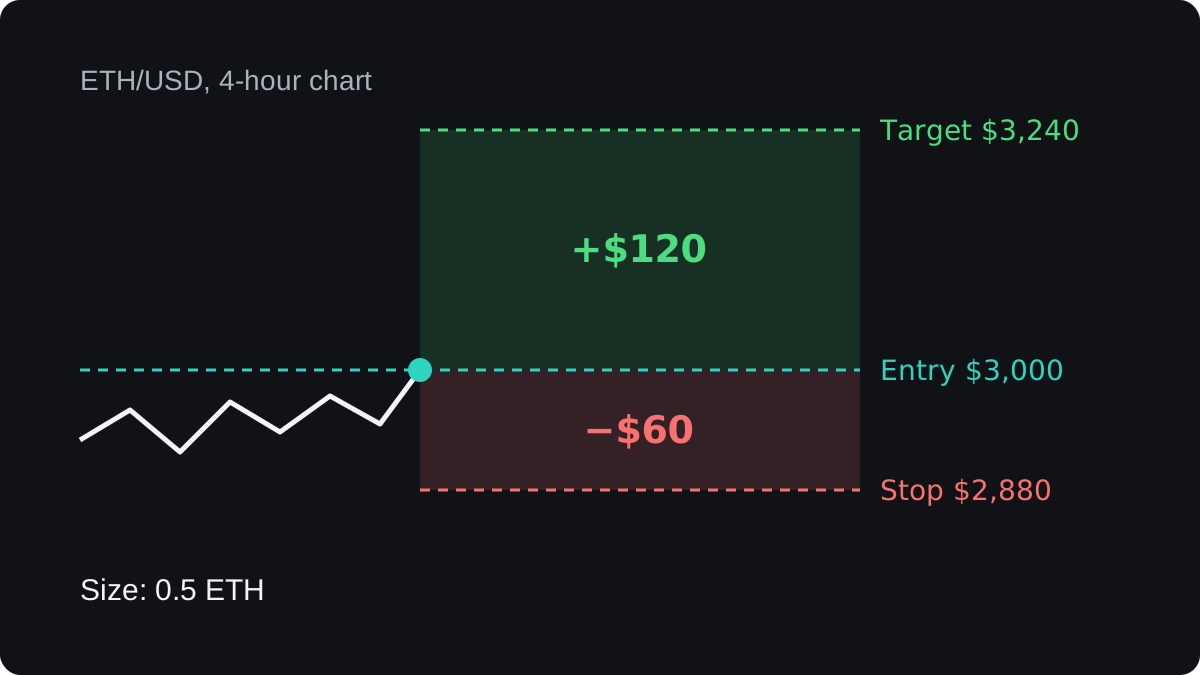
Now one trade, worked through with round illustrative numbers. Your account holds $6,000, and a 4-hour candle closes above the 20-candle high at $3,000.
- Risk: 1% of $6,000 = $60.
- Stop: 4% below $3,000 = $2,880, a distance of $120.
- Size: $60 ÷ $120 = 0.5 ETH, a position worth 0.5 × $3,000 = $1,500.
- Target: 8% above $3,000 = $3,240, a distance of $240.
- At the stop you lose 0.5 × $120 = $60. At the target you gain 0.5 × $240 = $120, both before fees.
The lesson on building entry and exit rules shows how to turn vague rules into exact ones. The lesson on a crypto trade from plan to exit follows one full trade, fees included.
Test on past prices, then on live ones
Run the rules over past charts, one candle at a time, and log every trade they would have taken, fees included. The backtesting lesson explains the method.
Measure results in R, the amount you risk on a trade. A full stop loss is −1R and the example target is +2R.
Say a test of 50 trades gives 20 winners and 30 losers. These figures are made up to show the arithmetic, and the example rules have not been tested:
- Before costs: 20 × 2R minus 30 × 1R = 40R minus 30R = +10R, or 0.2R per trade.
- Costs: a fee of 0.1% on each order plus a spread of up to 0.2% makes a round trip of about 0.4% of the position. With a 4% stop, 1R is 4% of the position, so 0.4% is 0.1R. Over 50 trades that is 5R.
- After costs: 10R minus 5R = +5R, or 0.1R per trade.
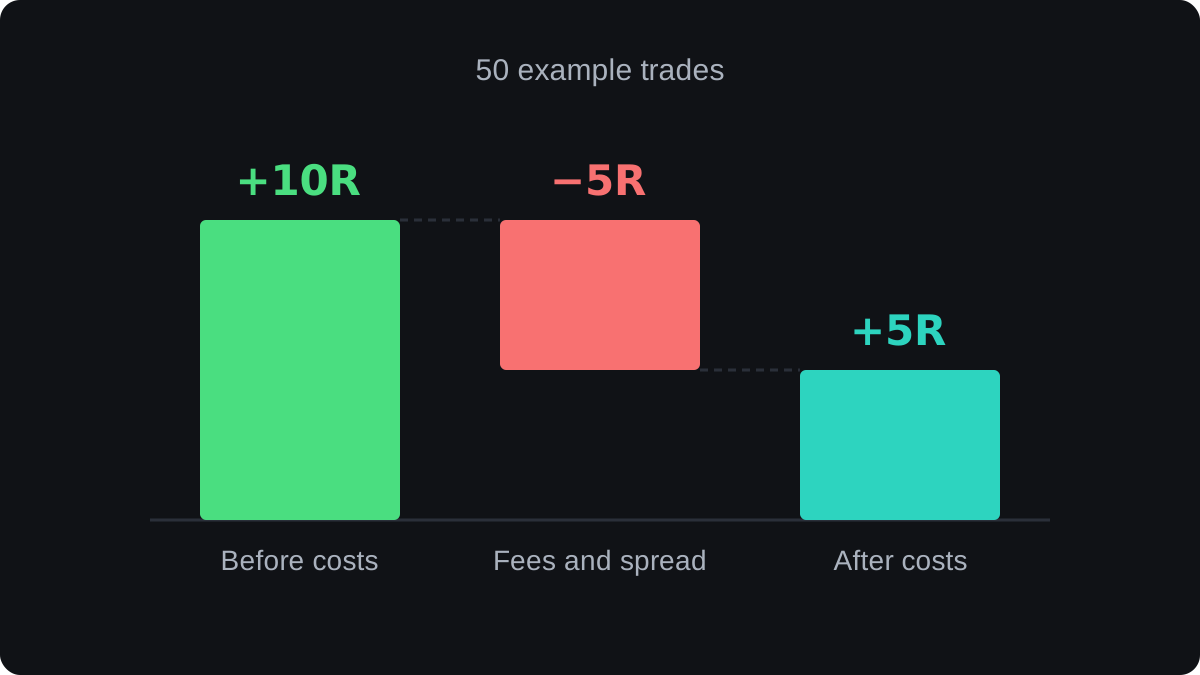
Costs took half the result here. With a tighter stop, the same 0.4% is a larger share of 1R, so strategies with small stops and targets lose even more to costs.
Then run the rules forward on a demo account or with very small size. This checks whether you can follow them in real time, night signals included.
The lesson on forward testing covers how long to run it.
A good test describes the past. It does not show that the rules will keep working, and results often drift when the market changes character.
Traps that flatter a crypto backtest
Testing only the survivors
If you test on the coins that are large today, you test only the ones that survived. Coins that collapsed or were delisted are missing, so the results look better than a trader at the time would likely have done.
Testing one kind of market
Crypto has had long rising phases and long falling ones. A trend strategy tested only during a big rise looks far better than it is. Include at least one long fall and one sideways stretch.
Tuning until the past looks perfect
If you adjust the 20 and the 50 until the test looks ideal, you have probably fitted noise. Change each setting a little. If the result collapses, the edge was likely luck.
Questions
What is the best crypto trading strategy?
No strategy is best for every trader or every market phase. The useful one is a written set of rules that you have tested with costs included and can follow under pressure.
How do I test a crypto strategy without risking money?
Backtest the rules on past charts, then forward test them on a demo account or with paper trades. Include fees and spread, and log every signal, including those at night and at weekends.
How many trades does a backtest need?
It needs enough trades to cover different market phases. A few dozen trades from one rising market tell you very little, and a few hundred across rising and falling periods tell you more.
Can I use a forex strategy on crypto?
You can test it, and you should expect to change the settings. Crypto usually needs wider stops and smaller positions, and it trades through nights and weekends, so retest the rules on crypto prices first.
Keep learning
 Chapter 2How to start trading crypto.To start trading crypto, first decide whether you want to own coins on an exchange or trade the price through a broker's CFDs. Then secure the account with 2FA, learn what each trade costs, practise on a demo or with tiny sizes, and set a fixed risk per trade before you choose a coin.
 Chapter 2Crypto trading principles that hold up.The crypto trading principles that hold up rest on arithmetic and behaviour, so they apply to any coin. Risk a small fixed share of the account on each trade, let the stop decide the size, expect fills worse than your stop, size the trade before leverage, count every fee, and keep your money safe outside the trade.
 Chapter 2A crypto trade from plan to exit.This example follows one bitcoin trade with round illustrative numbers. A $10,000 account risks 1%, so $100. Entry is $60,000, the stop $57,500 and the target $65,000, which gives a size of 0.04 BTC. The target is hit, and after $5 of fees the result is $195, or 1.95 times the amount risked.
 Chapter 2How to keep a crypto trading journal.Keep a crypto trading journal by writing the plan before each trade: venue, pair, setup, entry, stop, target, size in coins and risk in money. After the exit, record each fee as charged, the net result and R, and whether you followed the plan. Log deposits, withdrawals and wallet moves in a separate transfer log.

